What To Expect
This guide should include:
- Armory Spinnaker’s Application Logs with Docker
- Enabling A Logging Profile
- Logging Drivers for Docker
- Example: Logging to Splunk
- Example: Logging to Syslog
- Example: Logging to Sumo Logic
- Example: Logging to Datadog
- Validate Log Delivery
- Monitoring Spinnaker With Datadog
Armory Spinnaker’s Application Logs with Docker
Pushing your logs to a distributed service is as simple as using one of the logging drivers provided by Docker. All logging comes from STDOUT inside of Docker and can be pushed to various endpoints.
Enabling A Logging Profile
Armory Spinnaker exposes control over logging through Docker compose. The configuration is made available by files placed in /opt/spinnaker/compose and selected by setting the LOGGING_PROFILE environment variable. For example, if you want to create a syslog logging profile you would create the file /opt/spinnaker/compose/logging-syslog.yml and set LOGGING_PROFILE=syslog.
You can set a logging profile by changing the variable per environment. You can find the environment file that is used at startup at /opt/spinnaker/env.
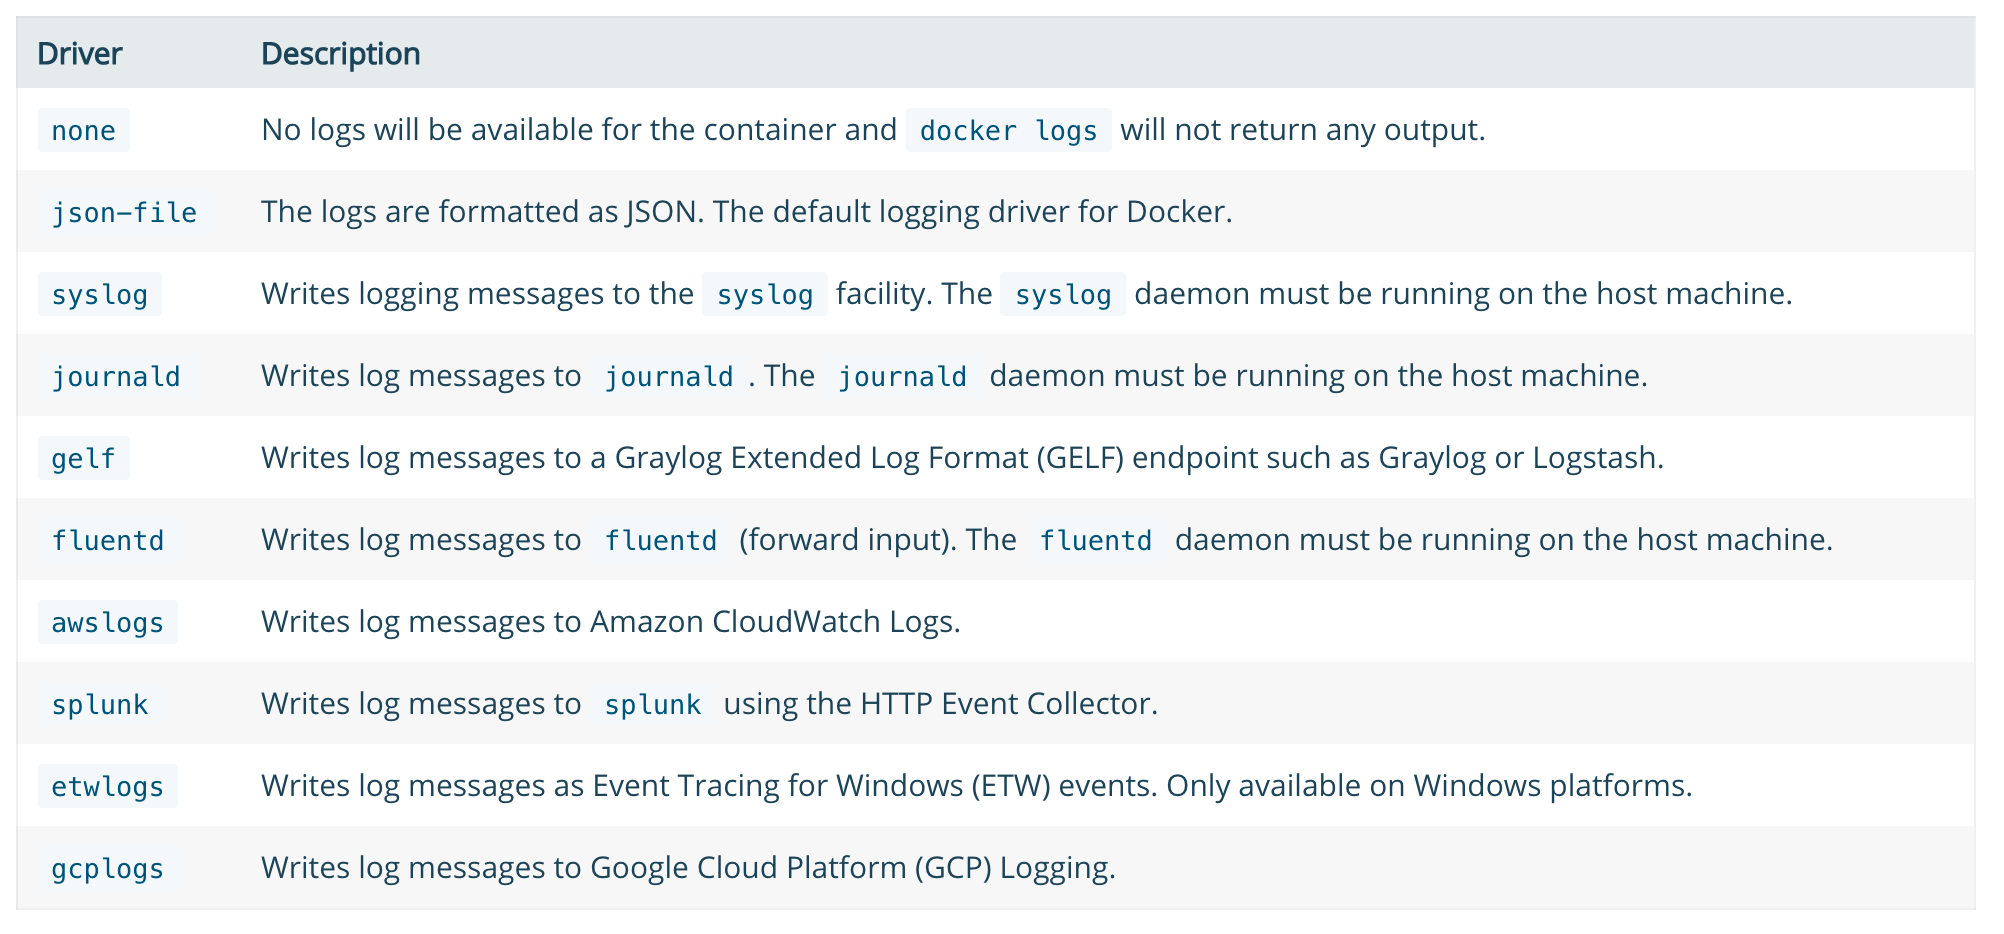
Logging Drivers for Docker
You can use any of the available logging drivers for Docker. At the time of this writing below are the supported drivers from Docker:
Example: Logging to Splunk
Below is a sample logging-splunk.yml file that can be used to extend Armory Spinnaker to log to Splunk. As there are many configuration options for Splunk and Docker. The one below is just a simple example of how to log to Splunk HTTP Event Collector. Place this file at /opt/spinnaker/compose/logging-splunk.yml and set LOGGING_PROFILE=splunk in your environment file located at /opt/spinnaker/env.
version: "2.1"
services:
  lighthouse:
    logging:
      driver: splunk
      options:
          splunk-token: ${YOUR_SPLUNK_TOKEN}
          splunk-url: https://${YOUR_SPLUNK_HOST}:8088
          splunk-insecureskipverify: "true"
  clouddriver:
    logging:
      driver: splunk
      options:
          splunk-token: ${YOUR_SPLUNK_TOKEN}
          splunk-url: https://${YOUR_SPLUNK_HOST}:8088
          splunk-insecureskipverify: "true"
  orca:
    logging:
      driver: splunk
      options:
          splunk-token: ${YOUR_SPLUNK_TOKEN}
          splunk-url: https://${YOUR_SPLUNK_HOST}:8088
          splunk-insecureskipverify: "true"
  rosco:
    logging:
      driver: splunk
      options:
          splunk-token: ${YOUR_SPLUNK_TOKEN}
          splunk-url: https://${YOUR_SPLUNK_HOST}:8088
          splunk-insecureskipverify: "true"
  deck:
    logging:
      driver: splunk
      options:
          splunk-token: ${YOUR_SPLUNK_TOKEN}
          splunk-url: https://${YOUR_SPLUNK_HOST}:8088
          splunk-insecureskipverify: "true"
  gate:
    logging:
      driver: splunk
      options:
          splunk-token: ${YOUR_SPLUNK_TOKEN}
          splunk-url: https://${YOUR_SPLUNK_HOST}:8088
          splunk-insecureskipverify: "true"
  gate:
    logging:
      driver: splunk
      options:
          splunk-token: ${YOUR_SPLUNK_TOKEN}
          splunk-url: https://${YOUR_SPLUNK_HOST}:8088
          splunk-insecureskipverify: "true"
Example: Logging to Syslog
Below is a sample logging-syslog.yml file that can be used to extend Armory Spinnaker to log to syslog. This example sends just clouddriver and lighthouse logs to syslog, but you can add the additional services as well by copying the configuration and changing the service name. Place this file at /opt/spinnaker/compose/logging-syslog.yml and set LOGGING_PROFILE=syslog in your environment file located at /opt/spinnaker/env.
version: "2.1"
services:
  lighthouse:
    logging:
      driver: syslog
      options:
        syslog-address: "tcp://192.168.0.42:123"

  clouddriver:
    logging:
      driver: syslog
      options:
        syslog-address: "tcp://192.168.0.42:123"
Example: Logging to Sumo Logic
Sumo Logic uses a different mechanism than Splunk and syslog. The preferred method is to run the sumologic-collector container (provided by Sumo Logic) alongside the default logging settings. To do this add/edit the /opt/spinnaker/compose/docker-compose.override.yml file and set DOCKER_COMPOSE_OVERRIDE=true in your environment file located at /opt/spinnaker/env. This is an example of a fresh docker-compose.override.yml that runs the Sumo Logic collector to send all Spinnaker logs:
version: "2.1"
services:
  sumologic-collector:
    container_name: sumologic-collector
    hostname: sumologic-collector
    image: sumologic/collector:latest
    volumes:
      - /var/run/docker.sock:/var/run/docker.sock
    command: ["${ACCESSID}", "${ACCESSKEY}"]
Note that ${ACCESSID} and ${ACCESSKEY} in the example above should be replaced with your actual Sumo Logic acceess keys. If this is your first Docker source configured through Sumo Logic you may have to configure the source on the Sumo Logic side. Please see the Docker Collector documentation from Sumo Logic for info about configuring a source.
Example: Logging to Datadog
In a similar fashion to Sumo Logic, Datadog uses an agent running on the host to collect and ship logs. To use the Datadog agent with your Armory Spinnaker installation, add/edit /opt/spinnaker/compose/docker-compose.override.yml and set DOCKER_COMPOSE_OVERRIDE=true in /opt/spinnaker/env. If you’ve created /opt/spinnaker/componse/docker-compose.override.yml, you would add the following content to the file:
version: "2.1"
services:
  datadog-agent:
    container_name: dd-agent
    hostname: dd-agent
    image: datadog/agent:latest
    environment:
      - DD_API_KEY=${DD_API_KEY}
      - DD_LOGS_ENABLED=true
      - DD_LOGS_CONFIG_CONTAINER_COLLECT_ALL=true
    volumes:
      - /var/run/docker.sock:/var/run/docker.sock:ro
      - /proc/:/host/proc/:ro
      - /opt/datadog-agent/run:/opt/datadog-agent/run:rw
      - /sys/fs/cgroup/:/host/sys/fs/cgroup:ro
You should replace DD_API_KEY with you Datadog API Key. For more information about configuring the Datadog agent, checkout their docs here.
Validate Log Delivery
After configuring distributed logging make sure logs are arriving before moving on. If this is the first time you’re setting up logging just searching for the Spinnaker services such as clouddriver or front50 should be enough. If you need to test a more complicated setup sometimes it’s best to run a manual execution for a pipleline or wait for a new pipeline to run, and then use the execution ID from the run to make sure all the parts are appearing that you expect.
If not all the logs are showing up you can get info about the logging setup from the Docker daemon. For example to see information about where clouddriver logs are going you can use this command:
docker inspect -f '{{.HostConfig.LogConfig}}' clouddriver
If the log config isn’t what you expect then something is wrong in the Armory Spinnaker config, and if the config is what you expect the problem is likely in your distributed logging setup.
Monitoring Spinnaker With Datadog
Spinnaker provides a monitoring container which exports metrics from the core sub-services. We’ll need to add two additional containers to our docker-compose setup: datadog and spinnaker-monitoring.
First, ensure the the metrics endpoint is enabled by adding the following configuration to spinnaker-local.yml if it isn’t already present.
services:
  spectator:
    webEndpoint:
      enabled: true
Add the following to /opt/spinnaker/compose/docker-compose.override.yml
version: "2.1"
services:
  datadog:
    container_name: datadog
    hostname: datadog${HOSTNAME_SUFFIX}
    env_file: /opt/spinnaker/config/datadog_api_token.txt
    environment:
      - "SD_BACKEND=docker"
    image: datadog/docker-dd-agent:latest
    ports:
      - "8125:8125"
    volumes:
      - /var/run/docker.sock:/var/run/docker.sock:ro
      - /proc/:/host/proc/:ro
      - /sys/fs/cgroup/:/host/sys/fs/cgroup:ro
  spinnaker-monitoring:
    container_name: spinnaker-monitoring
    hostname: spinnaker-monitoring${HOSTNAME_SUFFIX}
    image: armory/spinnaker-monitoring:version-0.1.0
    ports:
      - "8008:8008"
    volumes:
      - /opt/spinnaker/config/monitoring/registry/:/opt/spinnaker-monitoring/registry/
      - /opt/spinnaker/config/:/opt/spinnaker-monitoring/config/
In the configuration above /opt/spinnaker/config/datadog_api_token.txt is a secrets file which contains your Datadog API key
API_KEY=${YOUR_DATADOG_API_KEY}
Add a registry entry for each service you wish to monitor in /opt/spinnaker/config/monitoring/registry. You’ll need to create 1 file per service. The filename should correspond to the service being monitored and the contents should contain a metrics_url of the service. For example, an entry for monitoring Clouddriver would have a filename such as clouddriver.yml and the contents would be:
# /opt/spinnaker/config/monitoring/registry/clouddriver.yml
metrics_url: http://clouddriver:7002/spectator/metrics
Add the Spinnaker monitoring configuration file in /opt/spinnaker/config/spinnaker-monitoring-local.yml:
registry_dir: /opt/spinnaker-monitoring/registry

server:
  host: 0.0.0.0
  port: 8008

monitor:
  period: 30

  metric_store:
    - datadog

datadog:
  api_key: ${API_KEY}
We’ll then need to enable Armory to look for the override file. Add the following in your env file which is located at /opt/spinnaker/env/${STACK}.env
DOCKER_COMPOSE_OVERRIDE=true
Then restart Armory Spinnaker:
service armory-spinnaker restart