This application has been developed and is supported by Armory Inc. In case of technical questions, please contact Armory for support.
The integration of Spinnaker and Sumo Logic provides customers with the ability to monitor the health and productivity of their end-to-end software delivery process through live dashboards. Customers will gain at-a-glance visibility and longitudinal trends in usage and pipeline deployments across all dev, staging, and production environments.
- Log Types
- Sample Log Message
- Collect Logs for Spinnaker
- Install the Spinnaker App and View the Dashboards
- Limitations
Log Types
The Spinnaker Sumo Logic App uses echo logs that output event information from Spinnaker to Sumo Logic. Events include the following:
- Calls made to gate
- Pipeline events, which includes stages and tasks
Sample Log Message
{"details":{"source":"gate","type":"gate:session","created":"1567639483521","organization":null,"project":null,"application":null,"_content_id":null,"attributes":null,"requestHeaders":{}},"content":{"headers":{"x-request-id":"50cc1dcafa77a7fcf85612678cca01a6","sec-fetch-mode":"cors","referer":"https://spinnaker.se.armory.io/","sec-fetch-site":"same-site","x-forwarded-proto":"https","accept-language":"en-...
Note: Sumo Logic truncates messages greater than 64kb in length, and may therefore drop some event messages. Message lengths often depend on the size of your pipeline (i.e. number of stages).
Query sample
The following sample query generates a dashboard to monitor pipelines starting:
_sourceCategory="dev/sales-demo-cluster/echo" and _collector="Spinnaker Instance"  orca pipeline starting
| json field=_raw "content.execution.status","content.execution.application","details.type","content.execution.name","content.execution.trigger.type","content.execution.authentication.user" as status,application,logType,pipeline, triggerType, user nodrop
| where logType = "orca:pipeline:starting"
| timeslice by 1d
| count by _timeslice, pipeline
| transpose row _timeslice column pipeline
Collect Logs for Spinnaker
Collection Process Overview
Note: This assumes you have already installed Spinnaker and have access to the configuration files to make changes to Spinnaker.
Collection Step 1: Retrieve SumoLogic URL for HTTP logs
Configure an HTTP Source. And get a copy of the endpoint URL from your SumoLogic console.
Collection Step 2: Modify Spinnaker configuration to export logs to SumoLogic
-
Operator
Add to the
SpinnakerServicemanifest the following snippet:apiVersion: spinnaker.armory.io/v1alpha2 kind: SpinnakerService metadata: name: spinnaker spec: spinnakerConfig: profiles: echo: rest: enabled: true endpoints: - wrap: false url: [insert your custom HTTP endpoint] #e.g. https://endpoint1.collection.us1.sumologic.com/... -
Halyard
Add (and create if necessary) to
.hal/default/profiles/echo-local.ymlthe following:rest: enabled: true endpoints: - wrap: false url: [insert your custom HTTP endpoint] #e.g. https://endpoint1.collection.us1.sumologic.com/...
Collection Step 3: Apply changes
Run kubectl -n <spinnaker namespace> apply -f <SpinnakerService manifest> if using the Operator, or hal deploy apply if using Halyard, and wait for the services to restart. Check SumoLogic console for ingestion of data.
Install the Spinnaker App and View the Dashboards
Go to Sumo Logic App Catalog and search for “Spinnaker” by Armory
Dashboard filters
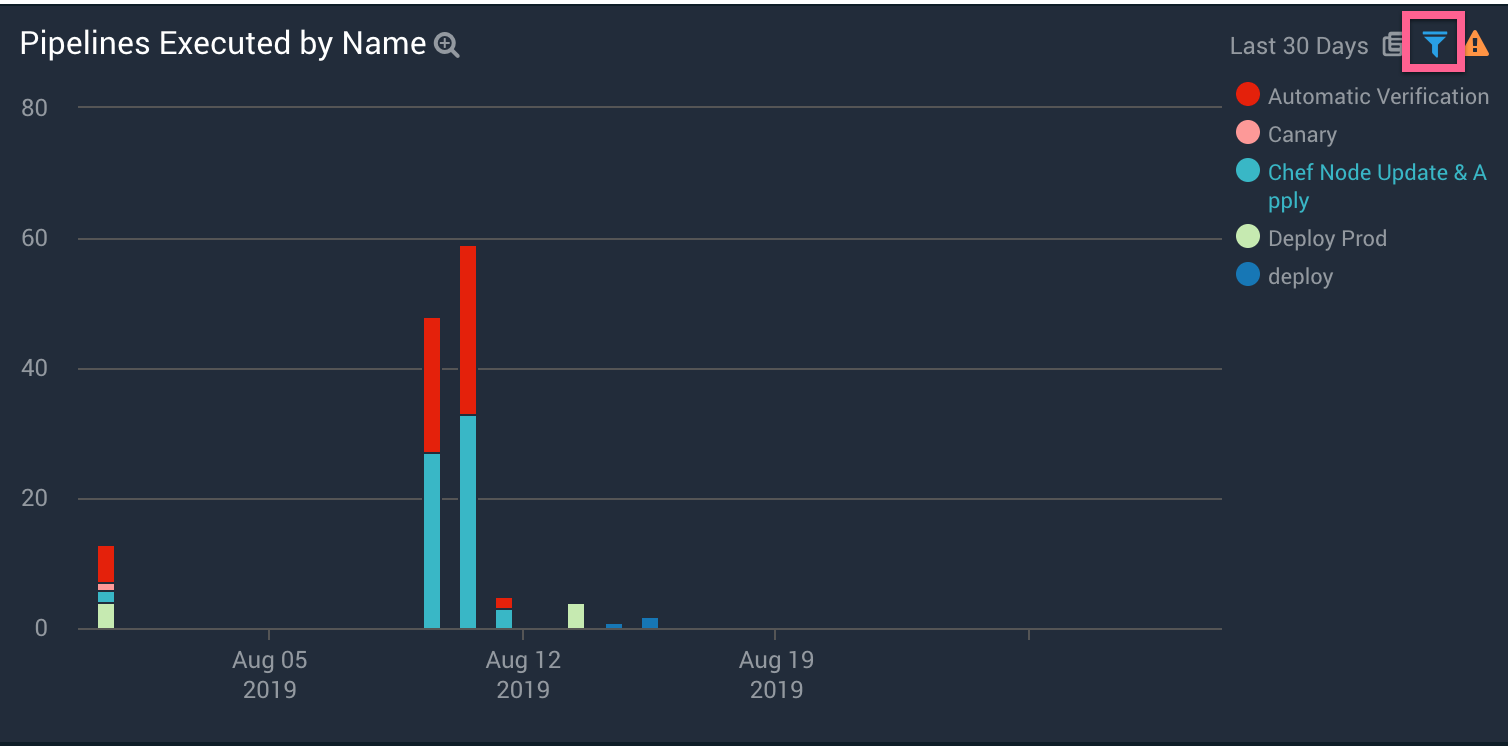
The Spinnaker Pipelines dashboard has a set of filters that you can apply to the entire dashboard as shown in the following example. Click the funnel icon in the top dashboard menu bar to display a scrollable list of filters that are applied across the entire dashboard.
NOTE: You can use filters to drill down and examine the data on a granular level by application and pipeline
 Each panel has a set of filters that are applied to the results for that panel only, as shown in the following example. Click the funnel icon in the top panel menu bar to display a list of panel-specific filters.
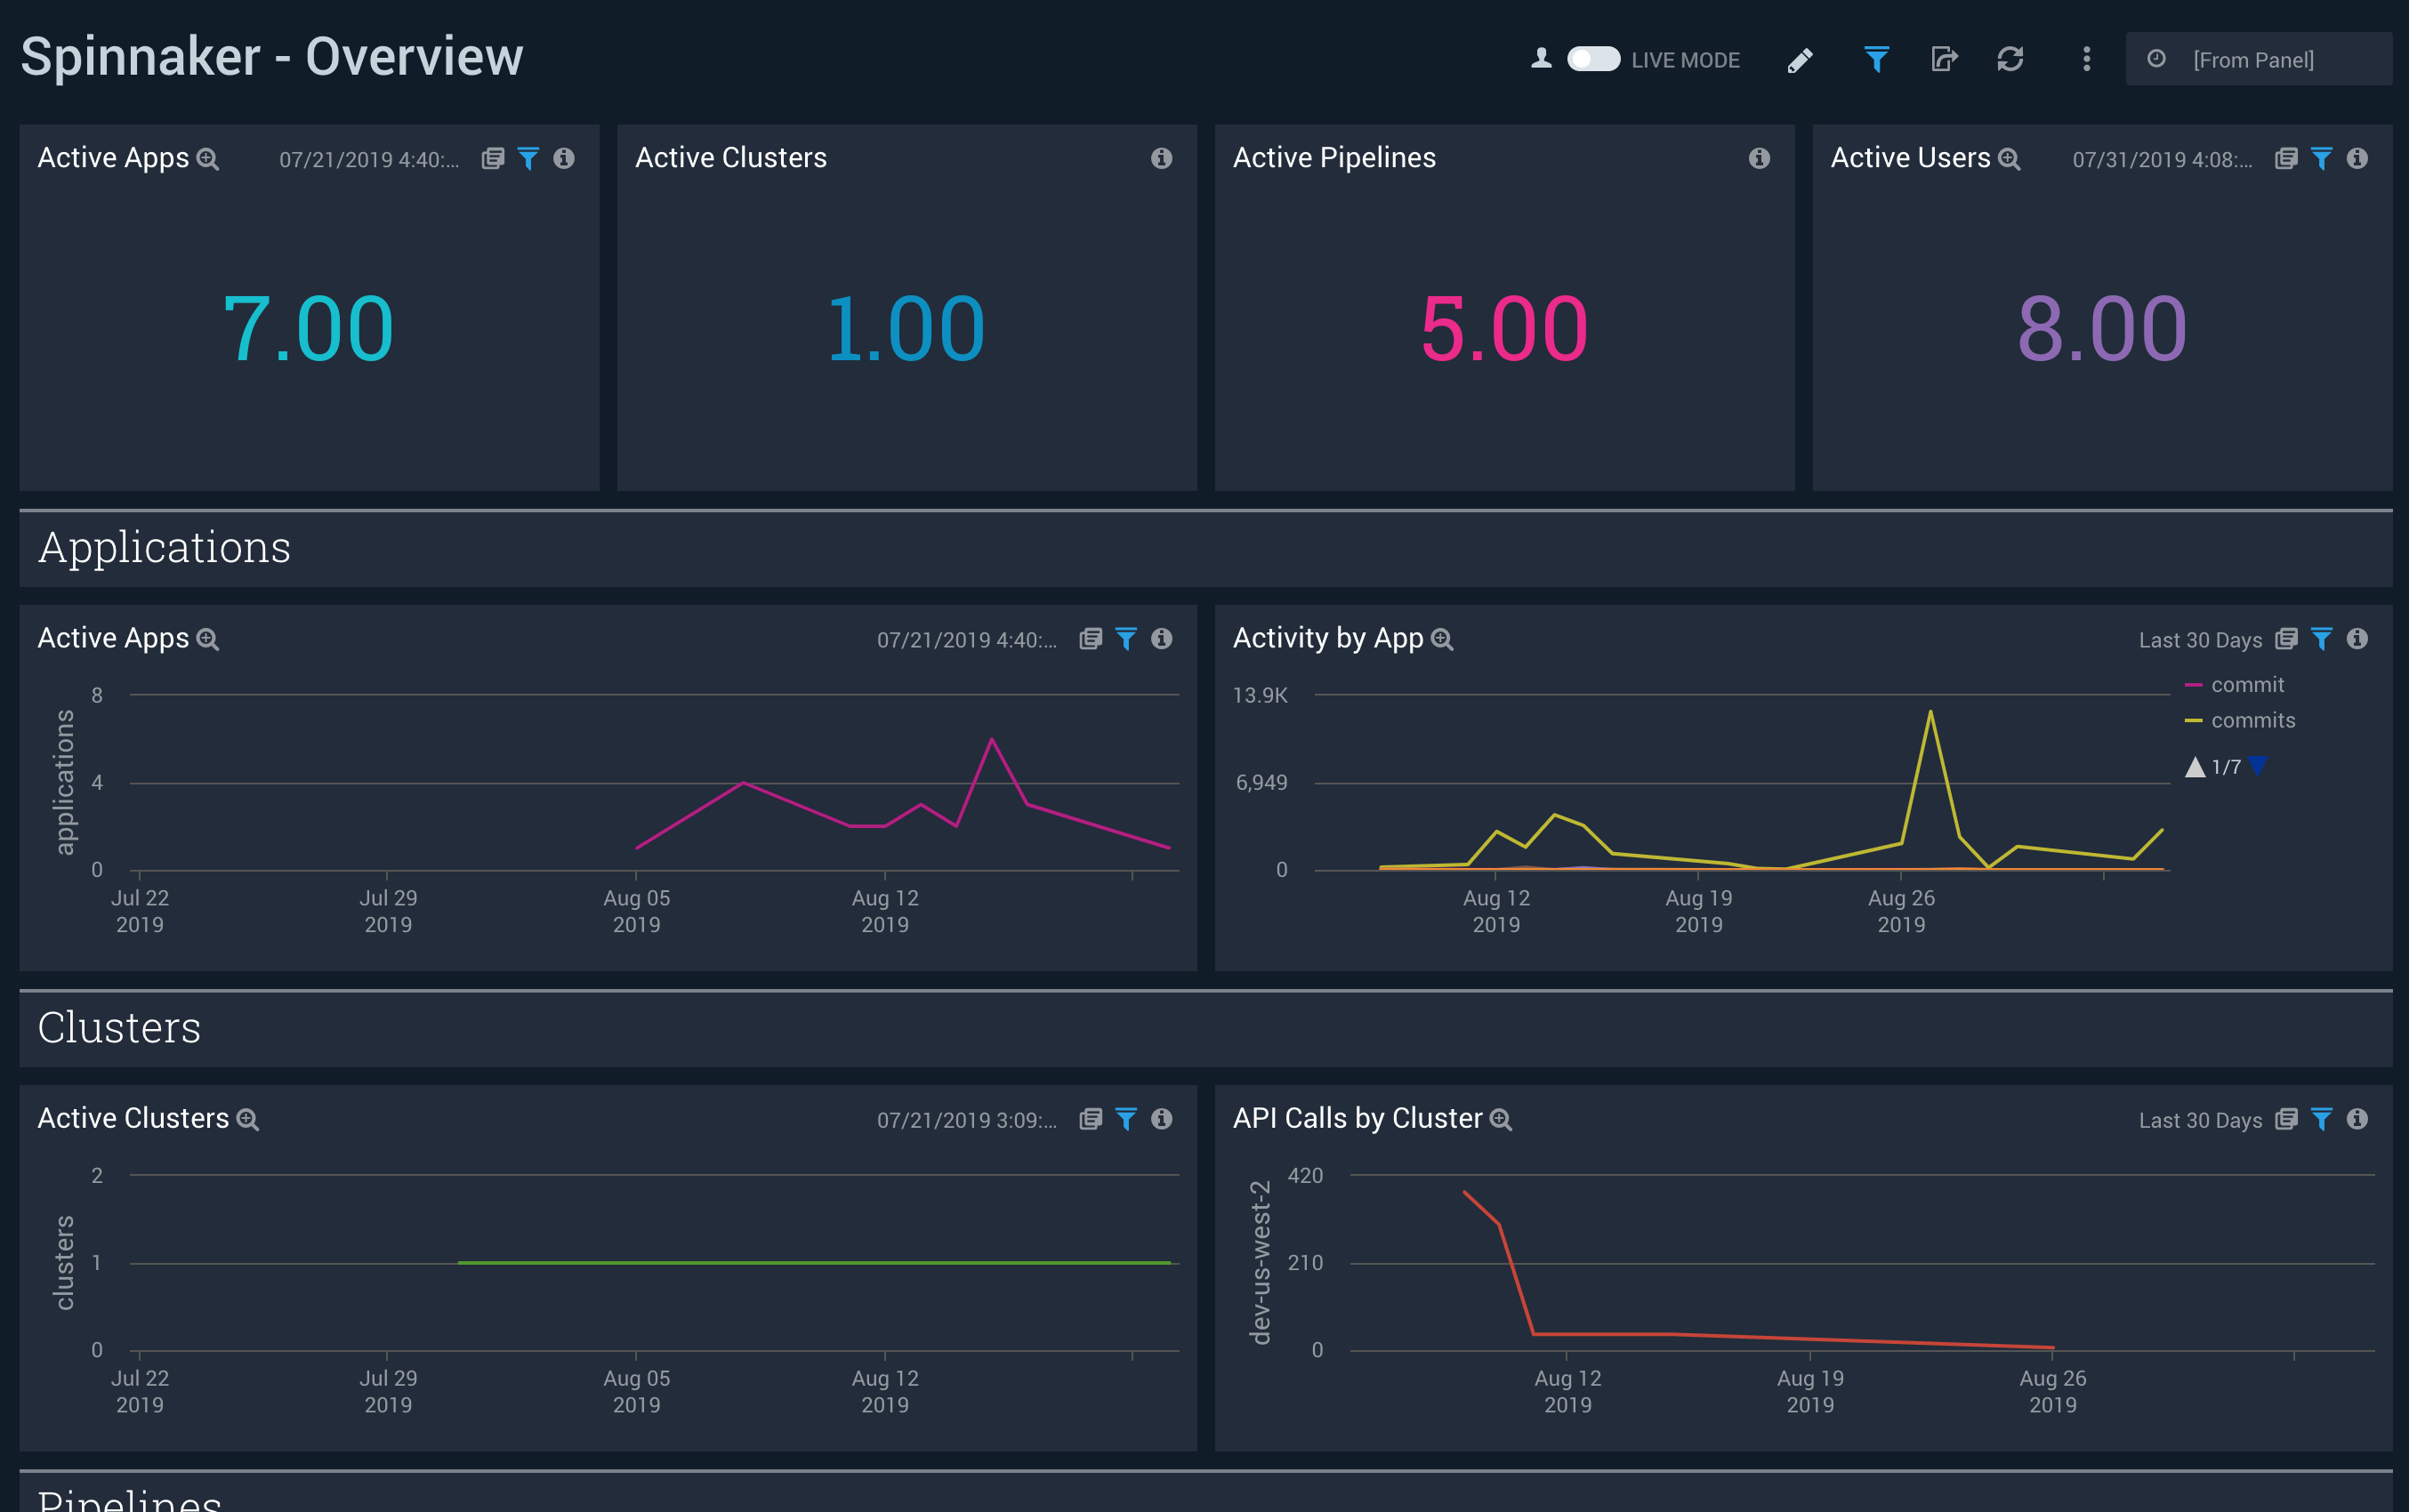
Spinnaker Overview Dashboard
The Spinnaker Overview provides the health and usage of your Spinnaker instance at a quick glance, including applications deployed, clusters targeted, pipelines run, and users in spinnaker. Use this dashboard to:
- Quickly see number of active apps, clusters, pipelines, and users.
- See activity levels apps, clusters, pipelines and users
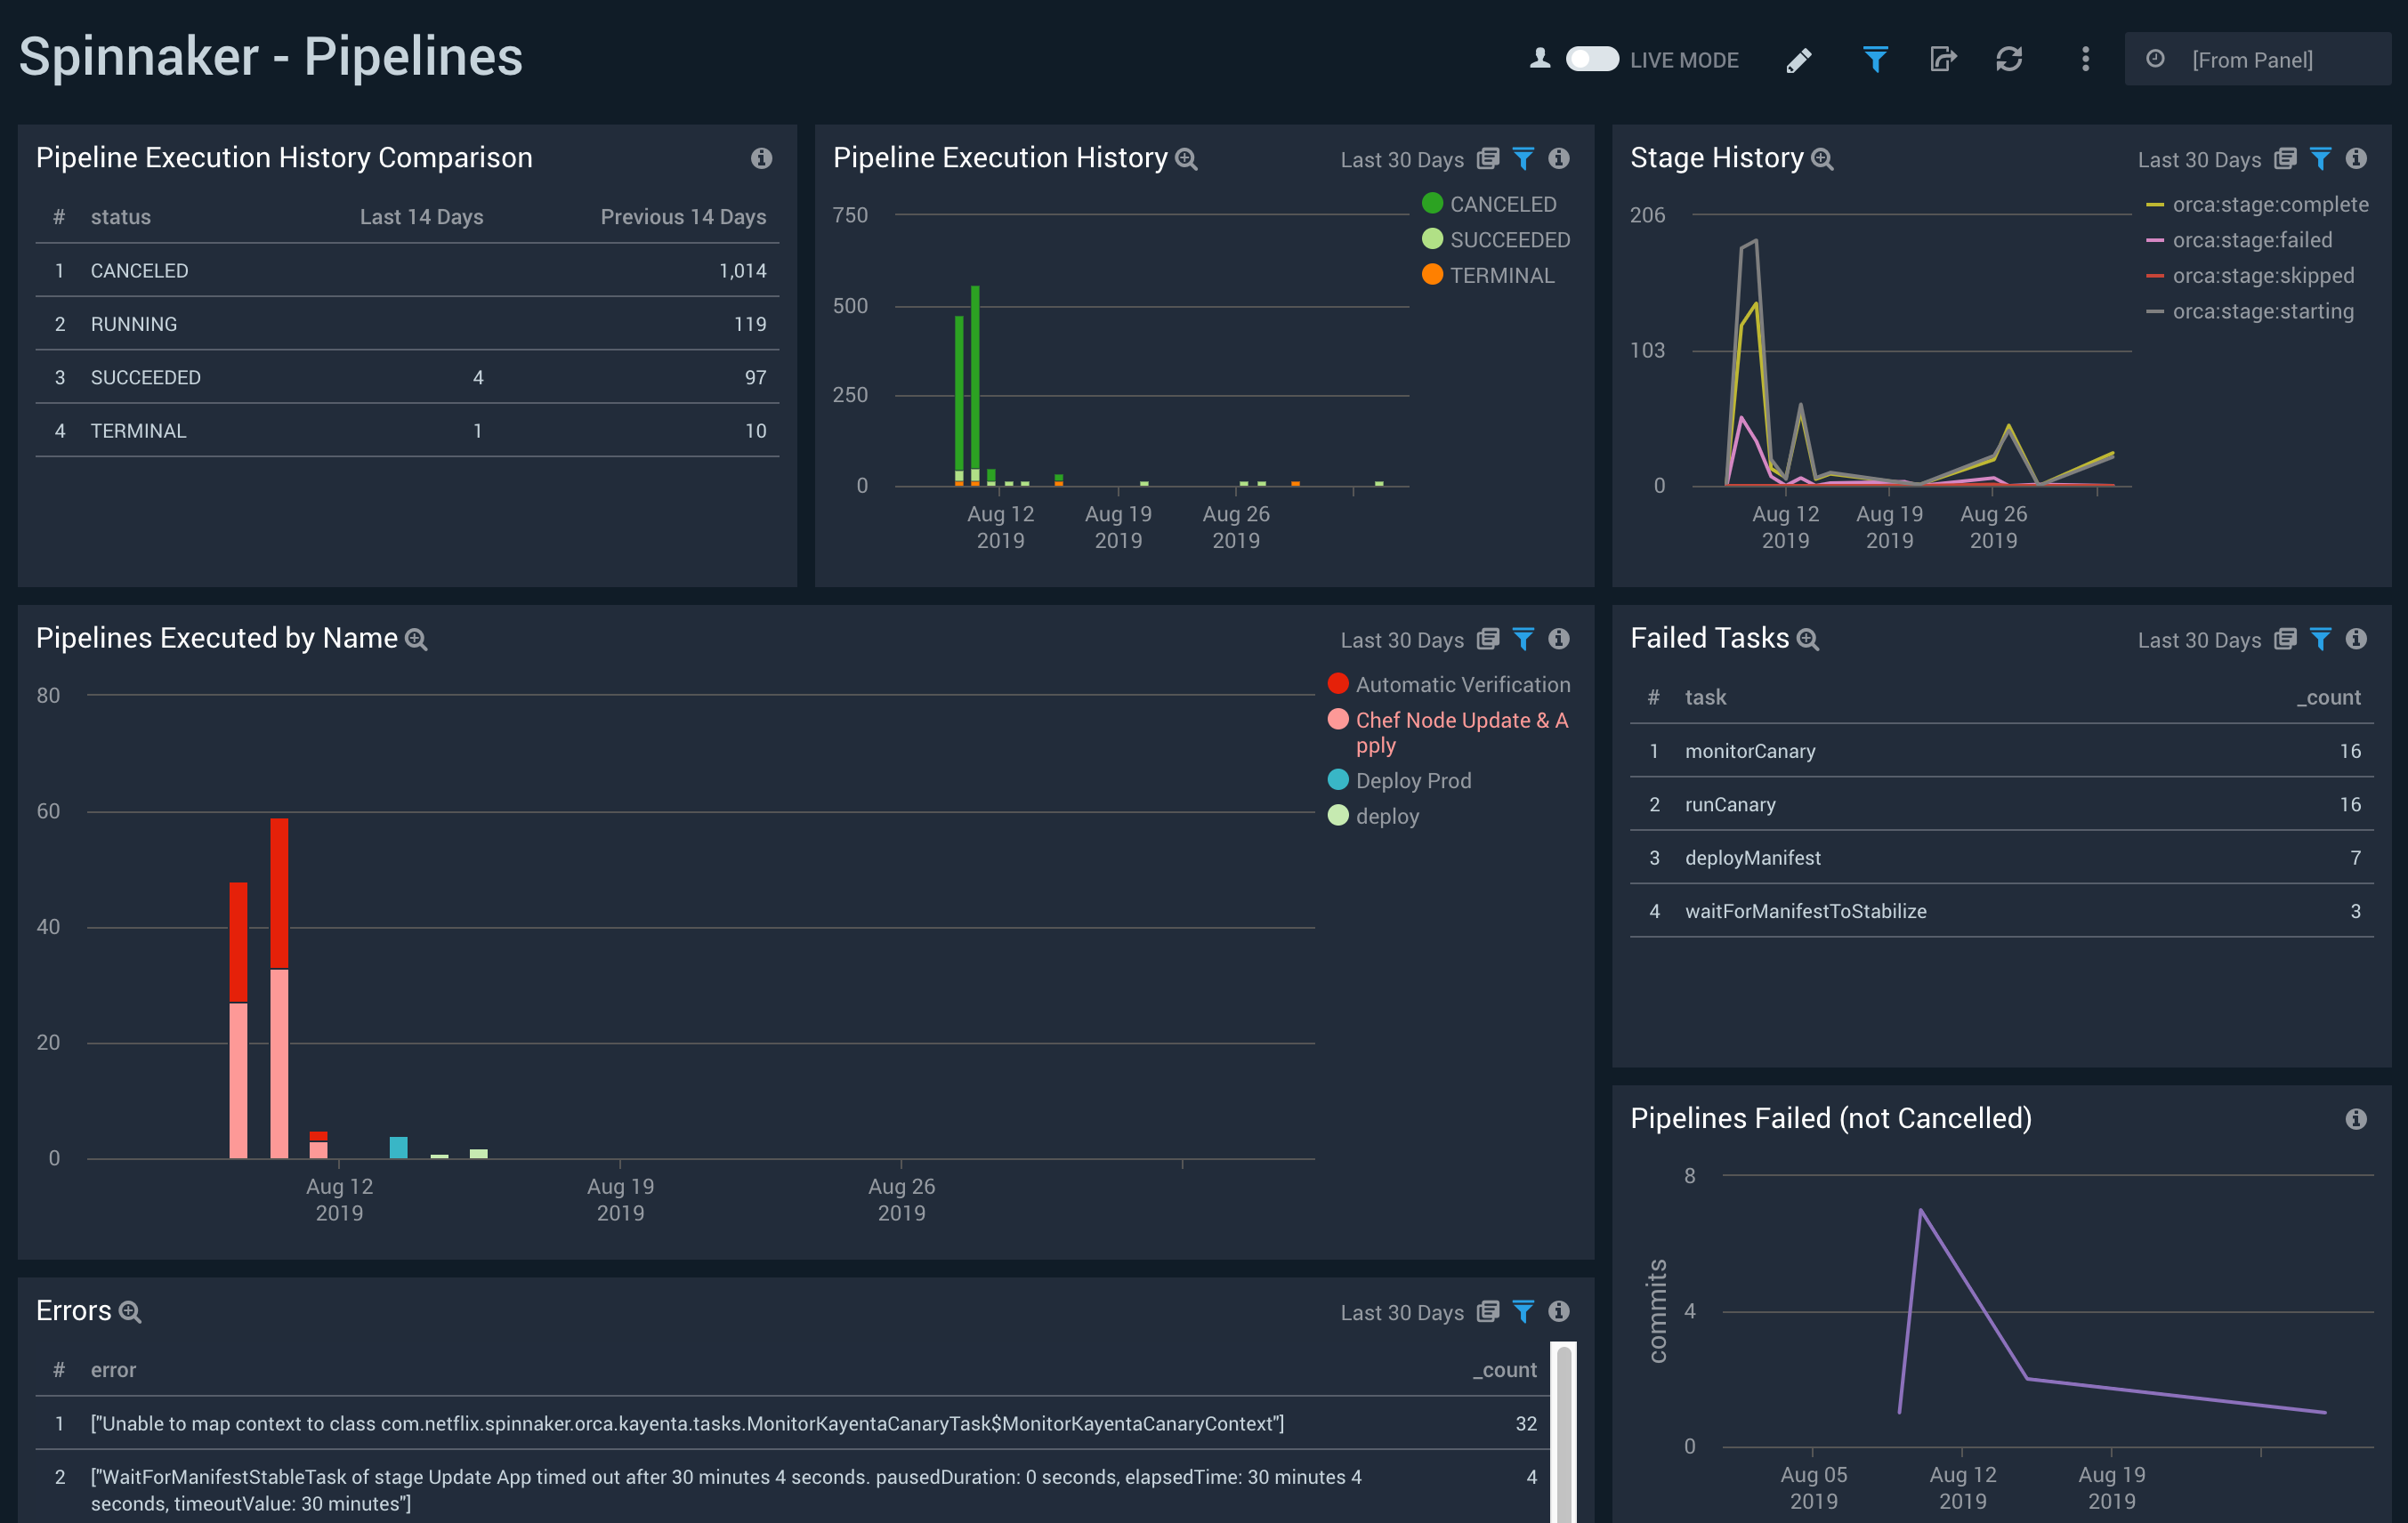
Spinnaker Pipelines Dashboard
This is a dashboard that contains pipeline execution history and metrics, including most common errors. Use this dashboard to:
- See pipeline execution history and compare the last 14 days to the 14 days that preceded them
- Understand which pipelines are executing and how often
- See which stages/tasks are failing most often
- Uncover the most common errors in your pipelines
- See how many pipelines have failed and completed over time
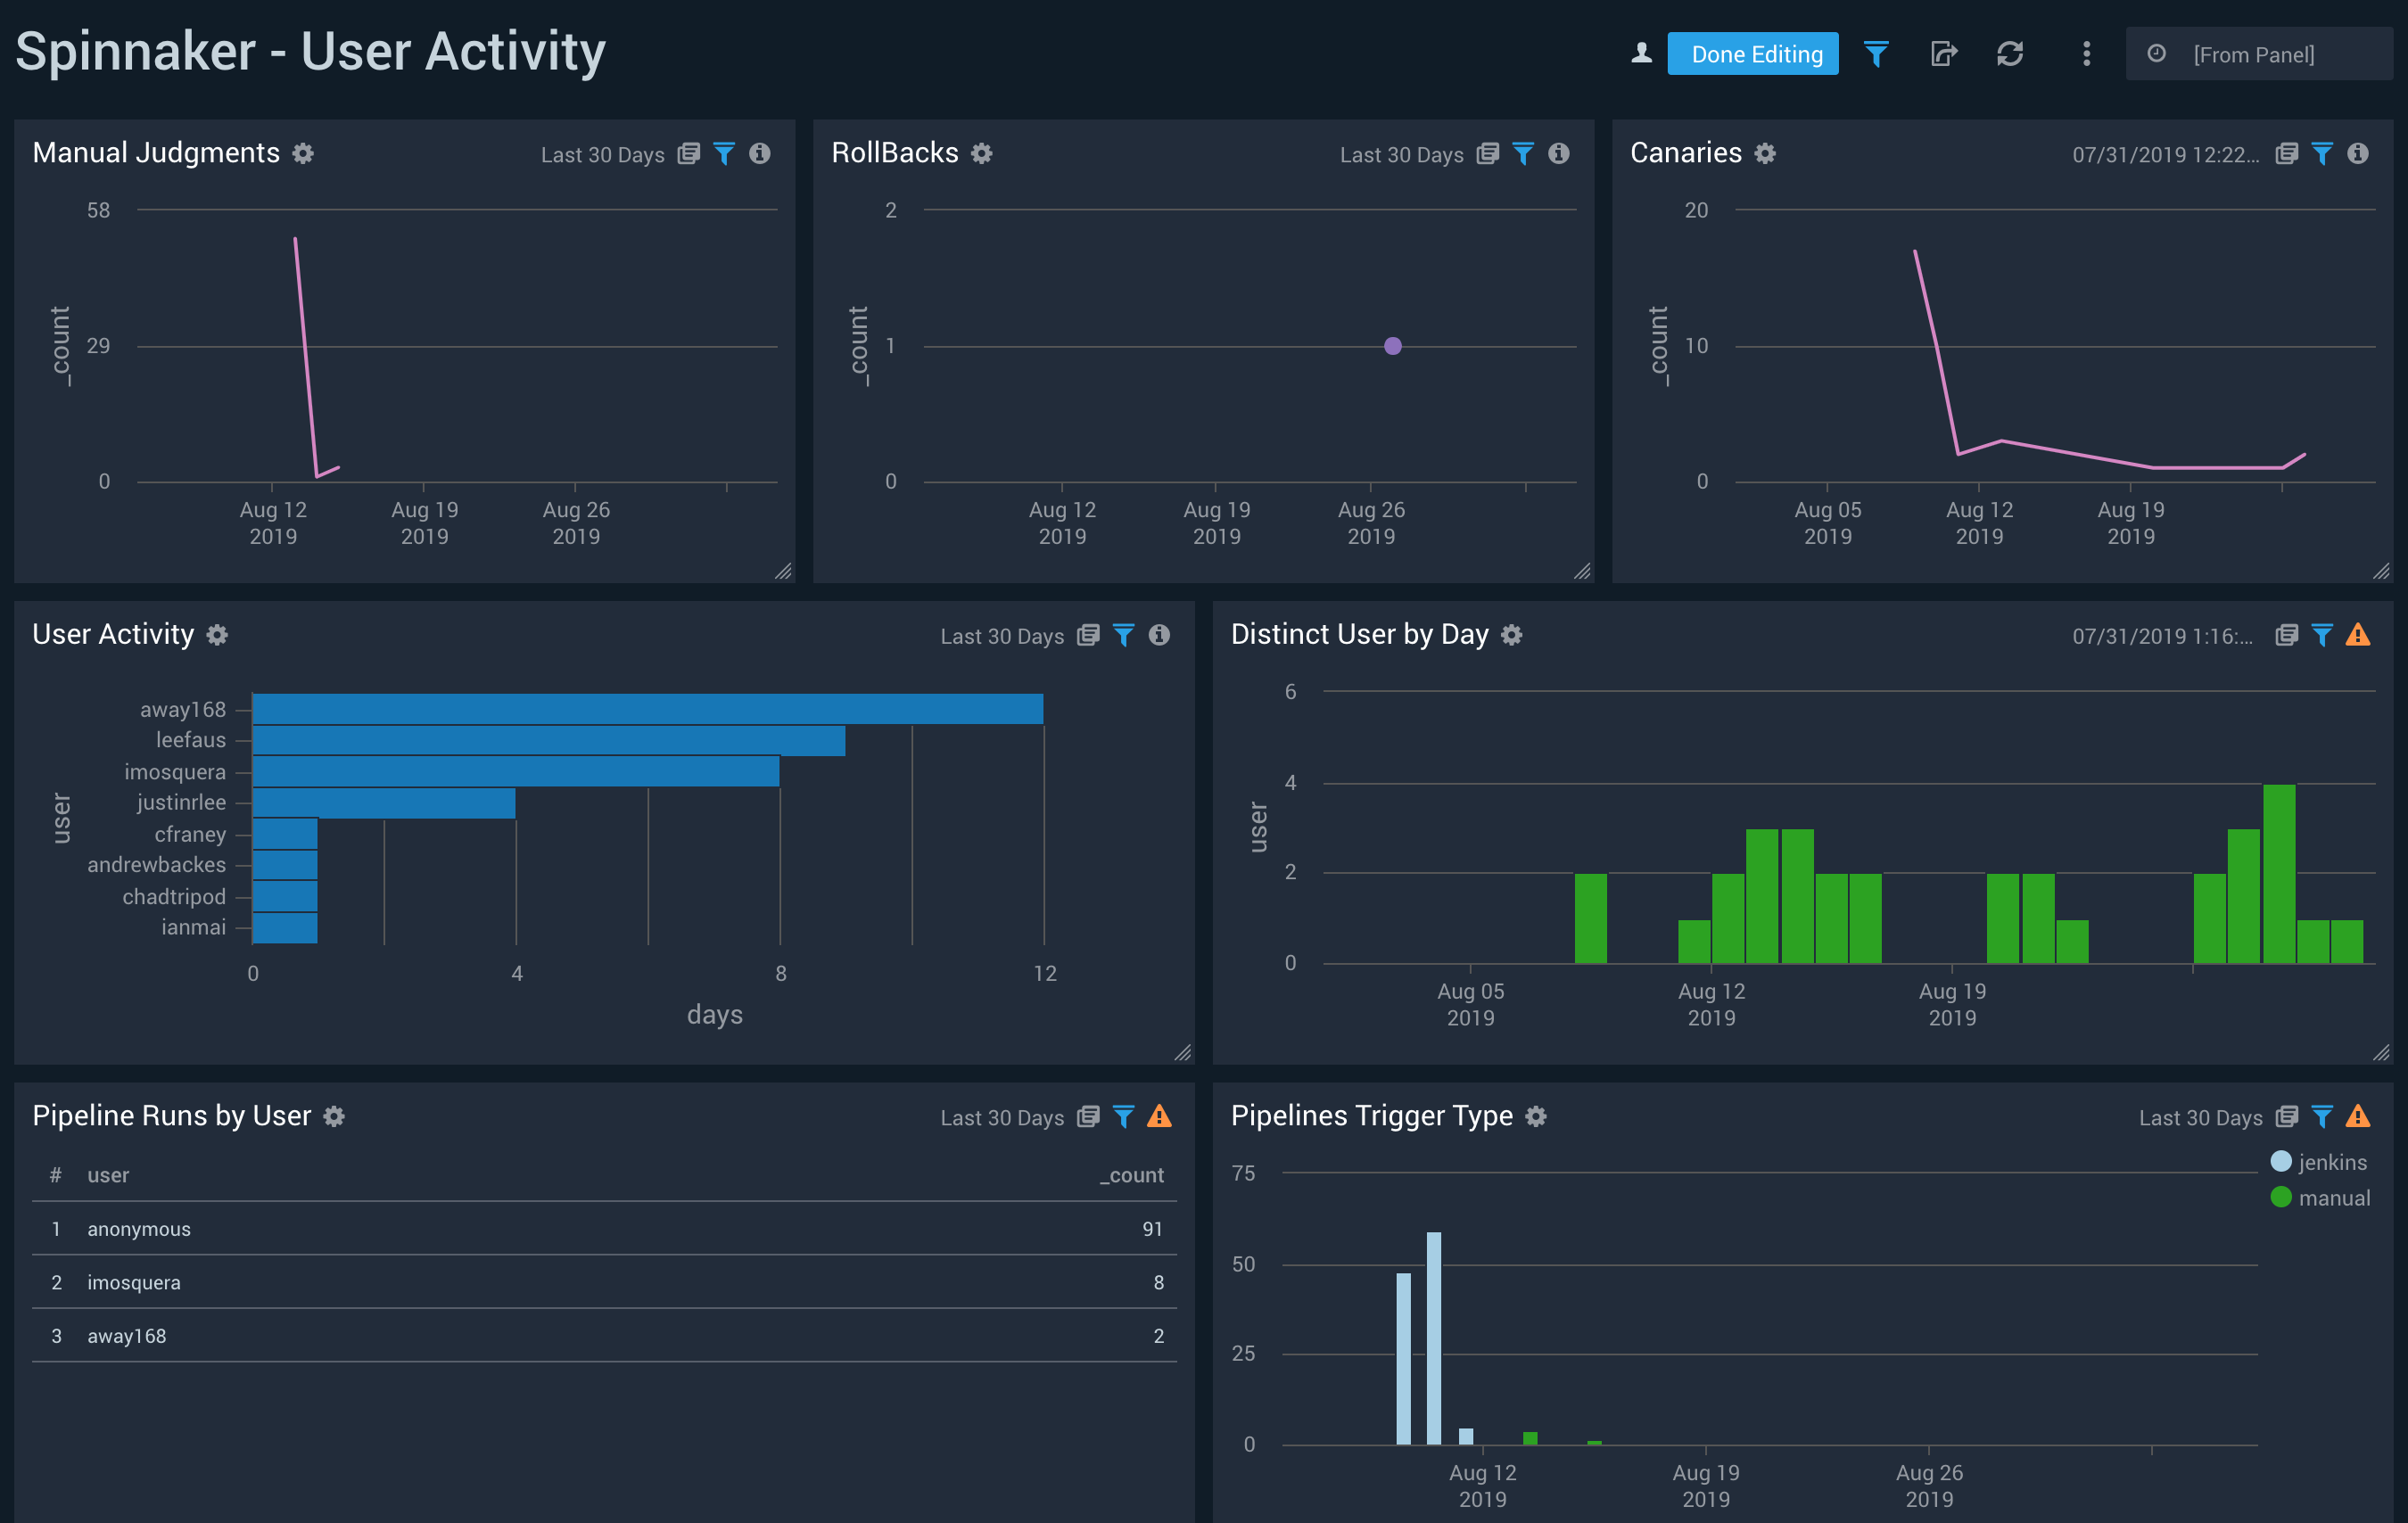
Spinnaker User Activity Dashboard
This is a dashboard that contains user activity, manual judgments, rollbacks, canary, and trigger metrics. Use this dashboard to:
- See how many manual judgments, rollbacks, and canaries have occurred over time
- See which users are most active and usage trends over time
- Understand how pipelines are getting triggered
Limitations
- Log messages greater than 64kb get truncated by the Sumo Logic collector. This means that there are potential events that will get dropped and not displayed in the dashboards. Long pipelines composed of many stages or triggered by other pipelines can make messages longer.