- Configure Kayenta
- Enable Canarying in Application
- Define a Canary Config
- Configuring A Canary Analysis Stage
- Automated Canary Deployment
- See Also
Configure Kayenta
The open source Spinnaker documentation has a good overview of how to configure Kayenta using Halyard at Set up canary support.
For Operator, the following example is an equivalent SpinnakerService manifest. The example config uses Datadog as a metrics provider and stores canary configs and analysis in a GCS bucket:
apiversion: spinnaker.io/v1alpha2
kind: SpinnakerService
metadata:
  name: spinnaker
spec:
  spinnakerConfig:
    config:
      canary:
        enabled: true   # Enable/disable canary analysis
        serviceIntegrations:
          - name: google
            enabled: true   # Enable/disable Google provider
            accounts:
            - name: my-google-account
              project: my-project-id       # The Google Cloud Platform project the Canary service uses to consume GCS and Stackdriver.
              jsonPath: gcp-sa.json        # File name of a JSON service account that Spinnaker uses for credentials. This is only needed if Spinnaker is not deployed on a Google Compute Engine VM or needs permissions not afforded to the VM it is running on. See https://cloud.google.com/compute/docs/access/service-accounts for more information. This field supports using "encryptedFile" secret references (https://docs.armory.io/spinnaker-install-admin-guides/secrets/).
              bucket: my-bucket            # The name of a storage bucket that your specified account has access to. If you specify a globally unique bucket name that doesn't exist, Kayenta creates that bucket.
              bucketLocation: us-central-1 # Required if the bucket you specify doesn't exist. In that case, the bucket gets created in that location. See https://cloud.google.com/storage/docs/managing-buckets#manage-class-location.
              rootFolder: kayenta          # The root folder in the chosen bucket to place all of the Canary service's persistent data in (Default: kayenta).
              supportedTypes:              # Array of: METRICS_STORE, CONFIGURATION_STORE, OBJECT_STORE
              - CONFIGURATION_STORE
              - OBJECT_STORE
            gcsEnabled: true               # Whether or not GCS is enabled as a persistent store (Default: false).
            stackdriverEnabled: false      # Whether or not Stackdriver is enabled Stackdriver as a metrics service (Default: false).
            metadataCachingIntervalMS: 60000 # Number of milliseconds to wait between caching the names of available metric types for use in building canary configs. (Default: 60000)
          - name: prometheus
            enabled: false  # Enable/disable Prometheus provider
            accounts:
            - name: my-prometheus-account
              endpoint:
                baseUrl: http://prometheus     # The base URL to the Prometheus server.
              username: my-username            # Basic auth username.
              password: abc                    # Basic auth password. This field supports "encrypted" field references (https://docs.armory.io/spinnaker-install-admin-guides/secrets/).
              usernamePasswordFile: prom-creds # The path to a file containing "username:password". This field supports "encryptedFile" references (https://docs.armory.io/spinnaker-install-admin-guides/secrets/).
              supportedTypes:                  # Array of: METRICS_STORE, CONFIGURATION_STORE, OBJECT_STORE
              - METRICS_STORE
            metadataCachingIntervalMS: 60000   # Number of milliseconds to wait between caching the names of available metric types for use in building canary configs. (Default: 60000)
          - name: datadog
            enabled: true   # Enable/disable Datadog provider
            accounts:
            - name: my-datadog-account
              endpoint:
                baseUrl: https://app.datadoghq.com # The base URL to the Datadog server.
              apiKey: my-api-key                   # Your org's unique Datadog API key. See https://app.datadoghq.com/account/settings#api. This field supports "encrypted" field references (https://docs.armory.io/spinnaker-install-admin-guides/secrets/).
              applicationKey: my-app-key           # Your Datadog application key. See https://app.datadoghq.com/account/settings#api. This field supports "encrypted" field references (https://docs.armory.io/spinnaker-install-admin-guides/secrets/).
              supportedTypes:                      # Array of: METRICS_STORE, METRICS_STORE, OBJECT_STORE
              - METRICS_STORE
          - name: signalfx
            enabled: false    # Enable/disable SignalFx provider
            accounts:
            - name: my-signalfx-account
              endpoint:
                baseUrl: https://stream.signalfx.com # The base URL to the SignalFx server. Defaults to https://stream.signalfx.com
              accessToken: abc                       # The SignalFx access token. This field supports "encrypted" field references (https://docs.armory.io/spinnaker-install-admin-guides/secrets/)
              defaultScopeKey: abc                   # Scope key used to distinguish between base and canary deployments. If omitted every request must supply the _scope_key param in extended scope params
              defaultLocationKey: abc                # Location key used to filter by deployment region. If omitted requests must supply the _location_key if it is needed.
              supportedTypes:                        # Array of: METRICS_STORE, METRICS_STORE, OBJECT_STORE
              - METRICS_STORE
          - name: aws
            enabled: false    # Enable/disable aws provider
            accounts:
            - name:  my-aws-account
              bucket: my-bucket       # The name of a storage bucket that your specified account has access to. If you specify a globally unique bucket name that doesn't exist, Kayenta creates that bucket for you.
              region: us-west-2       # The region to use.
              rootFolder: kayenta     # The root folder in the chosen bucket to place all of the Canary service's persistent data in (Default: kayenta).
              profileName: default    # The profile name to use when resolving AWS credentials. Typically found in ~/.aws/credentials (Default: default).
              endpoint: http://minio  # The endpoint used to reach the service implementing the AWS api. Typically used with Minio.
              accessKeyId: abc        # The default access key used to communicate with AWS. This field supports "encrypted" field references (https://docs.armory.io/spinnaker-install-admin-guides/secrets/)
              secretAccessKey: abc    # The secret key used to communicate with AWS. This field supports "encrypted" field references (https://docs.armory.io/spinnaker-install-admin-guides/secrets/)
              supportedTypes:         # Array of: METRICS_STORE, METRICS_STORE, OBJECT_STORE
              - CONFIGURATION_STORE
              - OBJECT_STORE
            s3Enabled: false          # Whether or not to enable S3 as a persistent store (Default: false).
          - name: newrelic
            enabled: false   # Enable/disable New Relic provider
            accounts:
            - name: my-newrelic-account
              endpoint:
                baseUrl: https://newrelic  # The base URL to the New Relic Insights server.
              apiKey: abc                  # Your account's unique New Relic Insights API key. See https://docs.newrelic.com/docs/insights/insights-api/get-data/query-insights-event-data-api. This field supports "encrypted" field references (https://docs.armory.io/spinnaker-install-admin-guides/secrets/)
              applicationKey: abc          # Your New Relic account id. See https://docs.newrelic.com/docs/accounts/install-new-relic/account-setup/account-id. This field supports "encrypted" field references (https://docs.armory.io/spinnaker-install-admin-guides/secrets/)
              supportedTypes:              # Array of: METRICS_STORE, METRICS_STORE, OBJECT_STORE
              - METRICS_STORE
        reduxLoggerEnabled: true           # Whether or not to enable redux logging in the canary module in deck (Default: true).
        defaultJudge: NetflixACAJudge-v1.0 # Name of canary judge to use by default (Default: NetflixACAJudge-v1.0).
        stagesEnabled: true                # Whether or not to enable canary stages in deck (Default: true).
        templatesEnabled: true             # Whether or not to enable custom filter templates for canary configs in deck (Default: true).
        showAllConfigsEnabled: true        # Whether or not to show all canary configs in deck, or just those scoped to the current application (Default: true).
        ...  # rest of config omitted for brevity
    files:
      gcp-sa.json: |
        <JSON CONTENT HERE. WATCH YOUR SPACING>
Note: You can delete all disabled provider sections.
Enable Canarying in Application
Before you can use Canary stages in your application’s pipelines, you’ll need to enable the Canary feature in the application’s config:
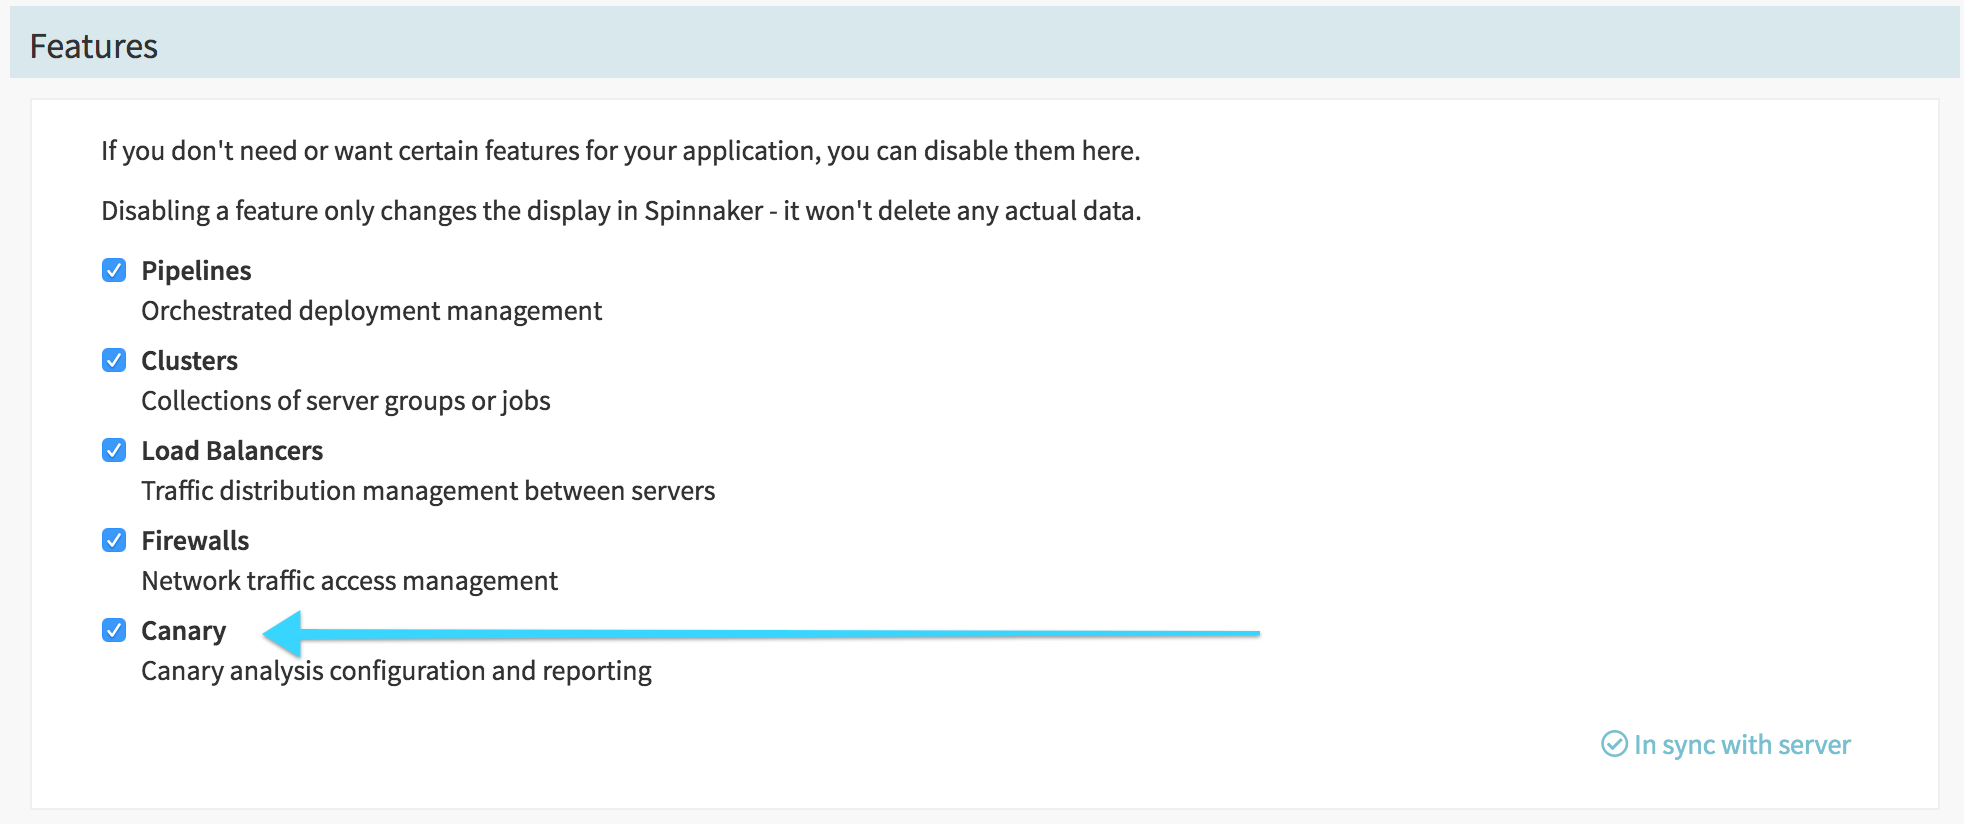
Make sure you remember to save the change. We recommend you refresh the page in your browser after enabling the feature before continuing.
Your Pipelines menu item should now be Delivery; if you click on it,
you’ll see Pipelines is a submenu item along with Canary Configs and
Canary Reports.
Define a Canary Config
Navigate to Canary Configs (under Delivery) to configure the metrics that
will be used to compare your canary deploy to your baseline. If you’ve
configured configs in other application, you may see them here already; you
can share configs across applications (unless you’ve disabled this option
with --show-all-configs-enabled false when configuring with halyard, or setting showAllConfigsEnabled: false in SpinnakerService manifest when configuring with Operator).
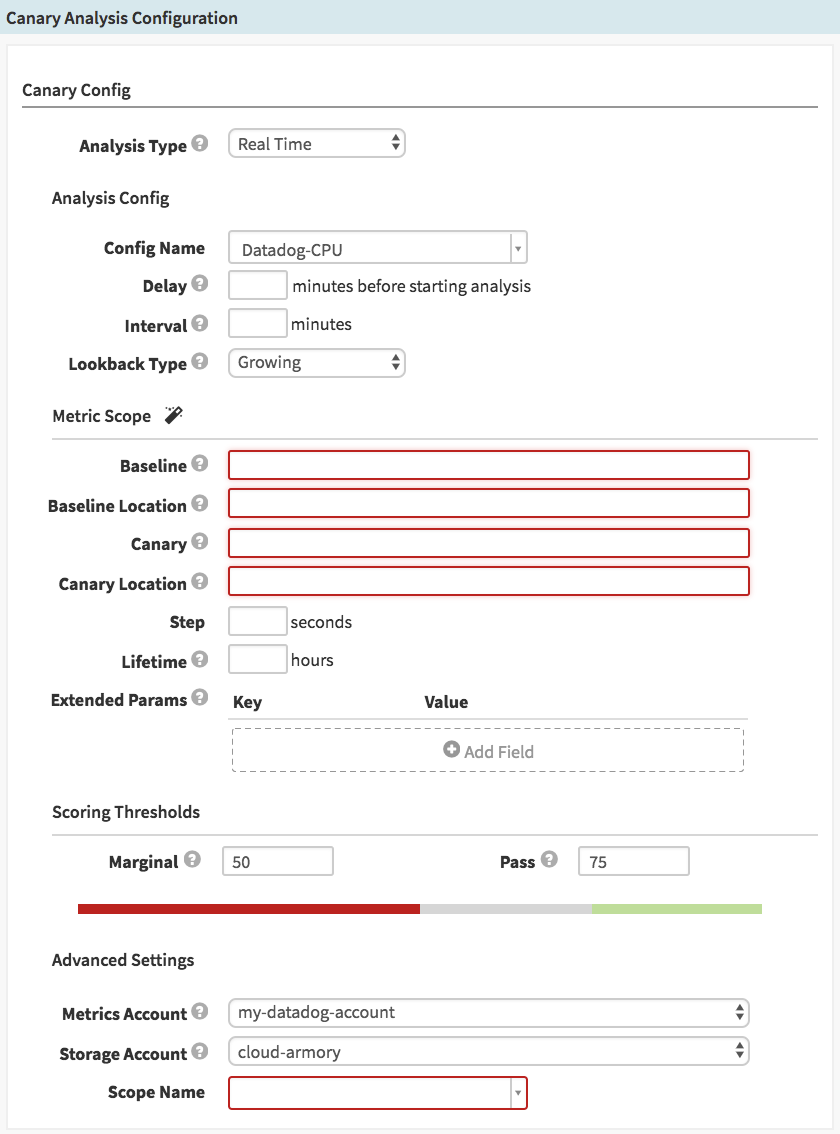
Click Add configuration and you should see a mostly-blank form:
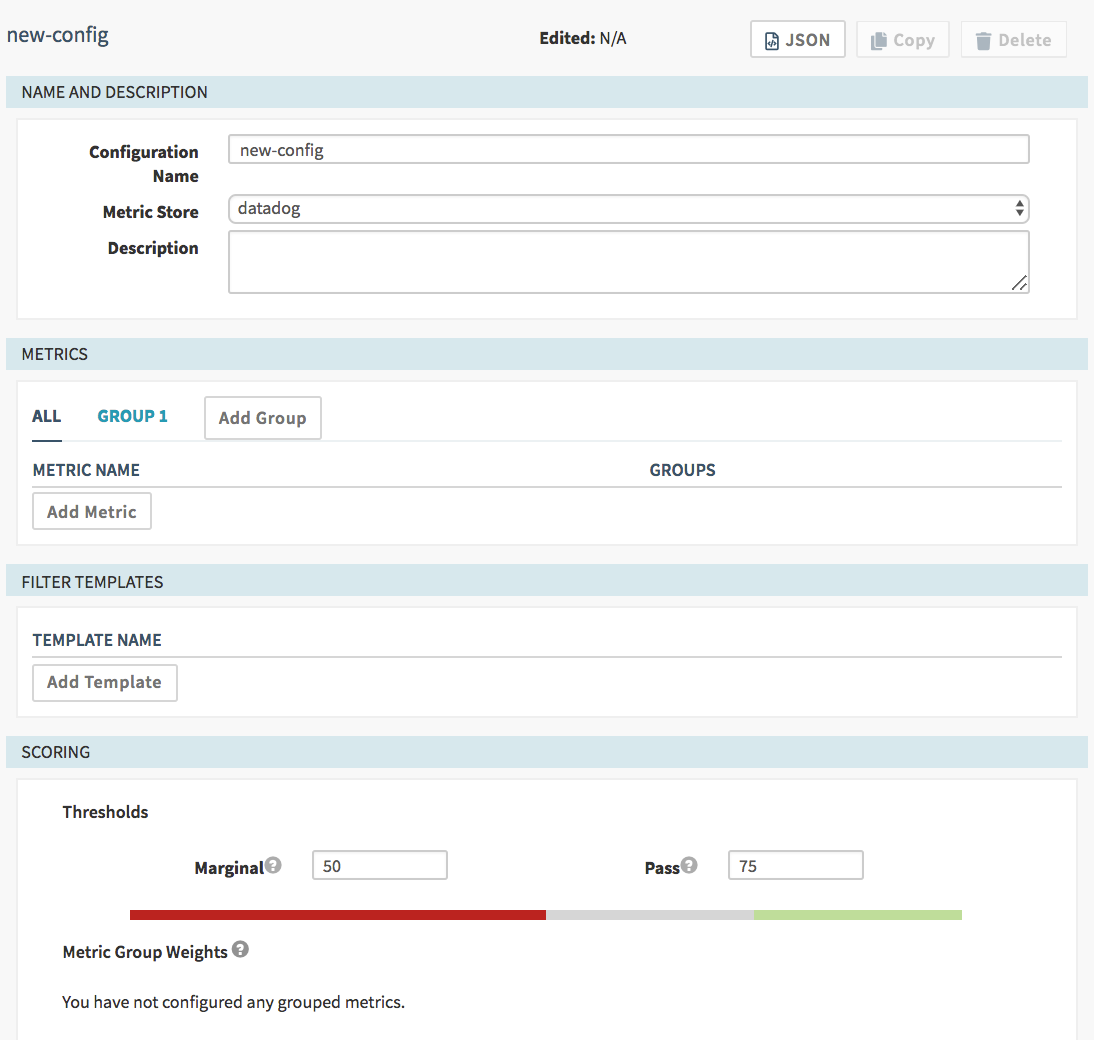
Configuration Name: Spaces are not allowed, only alphanumerics, hyphens and underscores. This name will be displayed as an option in the Canary stage configuration later, so we recommend you make it a meaningful name.
Metric Store: If you only configured one metrics store, this will already be set for you. Otherwise, you can choose from the options, the default will be the one you referenced in the environment file.
Description: Free form text to help your coworkers know what this Canary is doing.
More information can be found in the Spinnaker documentation.
Groups
A Canary Config can contain multiple groups of metrics, and each group can contain multiple metrics. By default “Group 1” is set up for you to add to; you can rename the group by clicking on the group and then clicking on the pencil icon next to it.
A group that has no metrics in it will be removed when the configuration is saved. If you create an extra group or want to delete an existing one, just be sure you’ve removed all the metrics from that group before saving.
Grouping is used to add different weights to the importance of different metrics or groups of metrics (see “Scoring” below).
Add Metrics
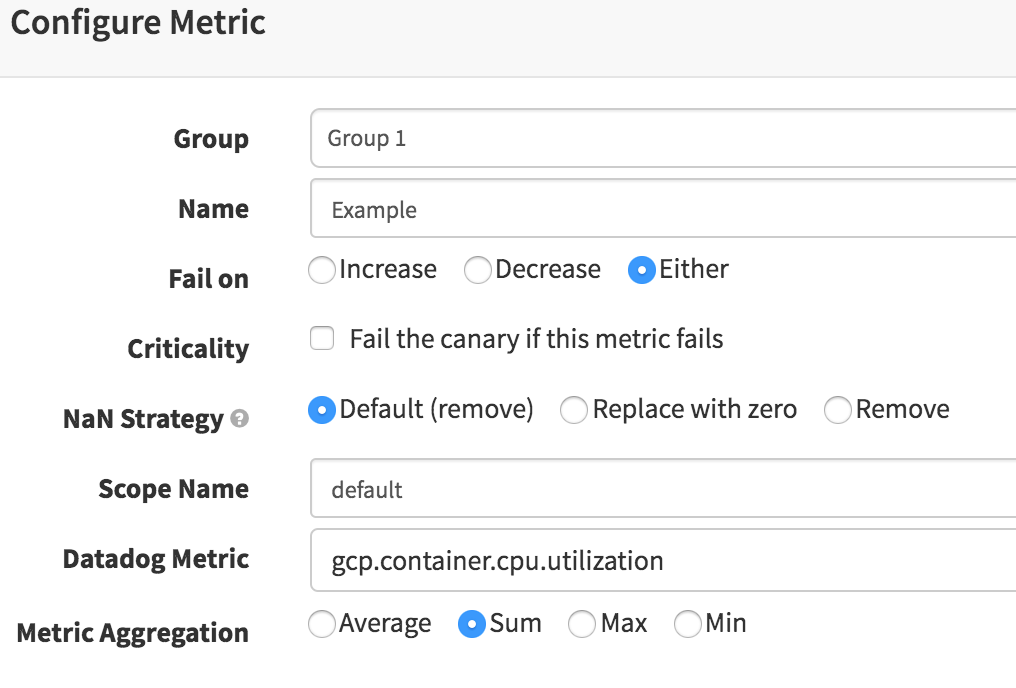
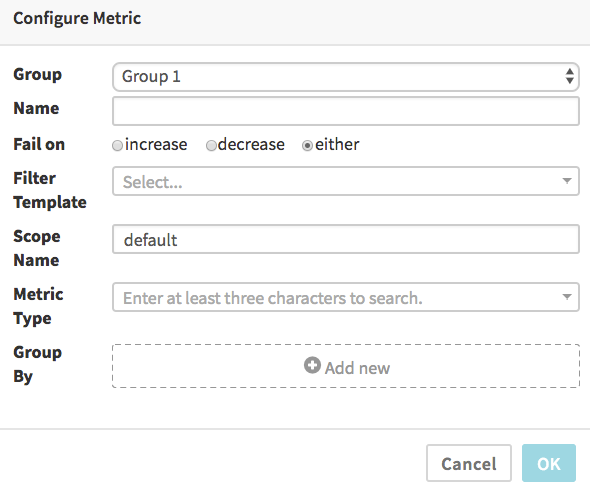
When you add a metric, the UI will be slightly different depending on what Metric Store you selected earlier. The DataDog dialog looks like:
The Stackdriver dialog looks like:
In all cases, the Name is free-form and used to label the results and graphs.
By default the “Fail on” selection of “either” means the comparison of canary and baseline metrics will be marked as a failure if the canary’s data is either significantly greater or less than the baseline’s data. You can select “increase” if you only want to fail when the canary’s metrics are significantly higher than the baseline (useful for things like error counts, memory and CPU usage, etc, where a significant improvement is not a failure), or, conversely, select “decrease” for the opposite (useful for metrics that measure things where bigger numbers are always better).
DataDog Metrics Aggregator
For DataDog, you need to select an aggregation function, either “Average”, “Sum”, “Max” or “Min”. Kayenta will request DataDog apply this function across all matching services when doing its query. Which function you use depends on what you’re measuring, and how you’ve set up your canary instances – if you have several instances running your canary, you may want to ‘average’ the CPU use across them, but perhaps you want to check for the “max” response time, or “sum” the amount of disk being used.
Stackdriver Metrics
Please refer to the Spinnaker Kayenta documentation for information on configuring Stackdriver metrics.
Filter Templates
Please refer to the Spinnaker Kayenta documentation for information on configuring Filter Templates. They are completely optional and may not be necessary for your application.
Scoring
After adding some metrics to groups, you should see each non-empty groups in this section, with scores defaulted to “0”. You’ll need to edit these scores to sum to 100 (if you’ve only created a single group, just set it to 100).
When the canary runs for a given interval, all the metrics are evaluated and each metric is given a pass/fail based on the deviation from the baseline metric. Within a group, each metric is evenly balanced (so if a group has two metrics, and one fails and one passes, the group is scored at 50%; if it had only one metric, it would score either 100% for a pass or 0% for a fail).
Each group is then scored their Metric Group Weight proportional to the success of the metrics in the group. A group with a weight of 40 and a 50% failure rate would score a total of 20 (50% of 40). The score of each group is added together for a final interval score. It’s this total score that is compared to the Thresholds evaluation. If the total is above the “Marginal” level, the canary will continue to run; if it’s less than the Marginal level, the canary will stop and record a failed stage immediately.
If the canary runs to completion, and all the intervals scored above “Pass”, the stage will be considered a success. If any interval fell into the grey area between Marginal and Pass, the stage will end with a failure, although it will not have been pre-emptively cancelled. This is intented to allow someone to look at the marginal responses and make their own evaluation of whether or not the pipeline should continue.
Configuring A Canary Analysis Stage
If everything is configured properly, you should be able to create a stage
of Type Canary Analysis. The stage form should look like this:
Analysis Type: “Real Time” (default) or “Retrospective”. If you select Retrospective, you’ll see two additional fields appear, where you will set the start and end time of the evaluation. This is the time period that will be examined on every execution of this stage, so it’s most useful for examining historical data, or just testing your configs before applying them to live systems.
Config Name: Here you select which Canary Config (which we created in the previous section) to use.
Delay: It may be useful to wait a few minutes after the previous deploy stages have completed, to let the systems get into a stable running state, before checking metrics. This field disappears if you’ve chosen to do a Retrospective analysis.
Interval: This defines the time between metrics inspections. If this is set to 30, for example, the metrics will be compared only twice during a 1-hour canary; if set to 5, it would be inspected 12 times during a 1-hour canary (see Lifetime, below).
Lookback Type: “Growing” (default) or “Sliding”. If set to “Growing”, the metrics are queried from the start of the canary up to the time of the interval. If set to “Sliding” (and you set the look back duration), it will only look at the metrics for that sliding window of time.
Metric Scopes: See below for details on this section.
Step: How many seconds between each metric datapoint to query. NOTE: For DataDog, this field is ignored (DataDog does not let you define the interval)
Lifetime: How many hours to let this canary analysis run before making a final determination. Note that if any single interval falls below a “Marginal” score, the analysis will stop immediately.
Scoring Thresholds: These are defaulted to whatever is configured in the Canary Config – however, you can adjust these scores on a per-pipeline basis if desired.
Metrics Account: Select which account to use for metrics (if you’ve configured multiple). NOTE: If you’ve configured multiple metrics providers, like DataDog AND Stackdriver, be sure you’ve selected an account that matches the Canary Config’s Metric Store. The UI currently does not prevent you from selecting, for example, a Stackdriver account here, after selecting a Canary Config based on Datadog.
Storage Account: Select which account to use for storing the metrics data and graphs.
Scope Name: Select Default for now.
Metric Scopes
This section gets filled in differently, depending on which metrics provider you’re using, and how you’ve set up your pipeline prior to this stage.
For more information on configuring these scopes, please refer to the Spinnaker Kayenta Documentation.
DataDog
DataDog only uses the Baseline and Canary fields; the Location fields are not used and can be safely left blank. The expected values here are the tag:value pairs that you are using to identify your canary and baseline deployments. You can use pipeline expressions in these fields to reference the tags that may have been generated in previous stages.
For example, if you were deploying to EC2 and you’ve cloned your current server group to be your baseline in an earlier stage, you might set the Baseline field to:
${ 'autoscaling_group:' + #stage('Clone Server Group')['context']['source']['serverGroupName'] }
You can further refine the results by appending further tag:value pairs
separated by commas, such as autoscaling_group:myapp-v001,region:us-west-2.
Stackdriver
The Spinnaker documentation is the best source for configuring Stackdriver metrics.
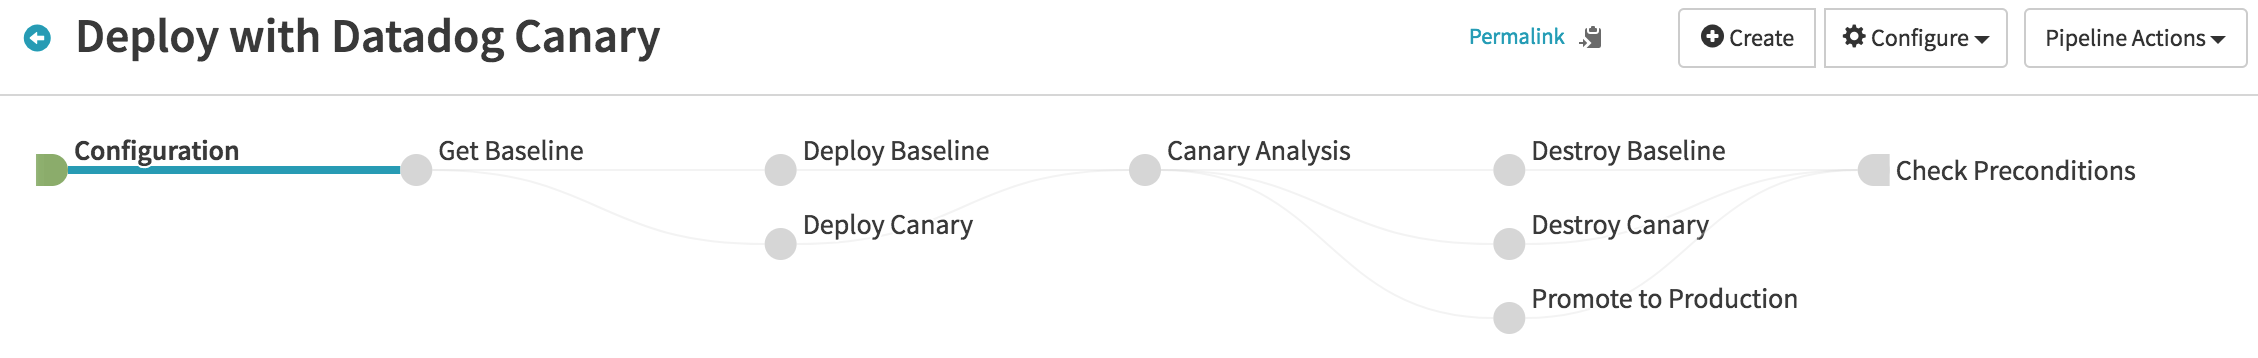
Automated Canary Deployment
Here’s a simple example of using Kayenta to automate canary analysis before promoting a build to full production status.
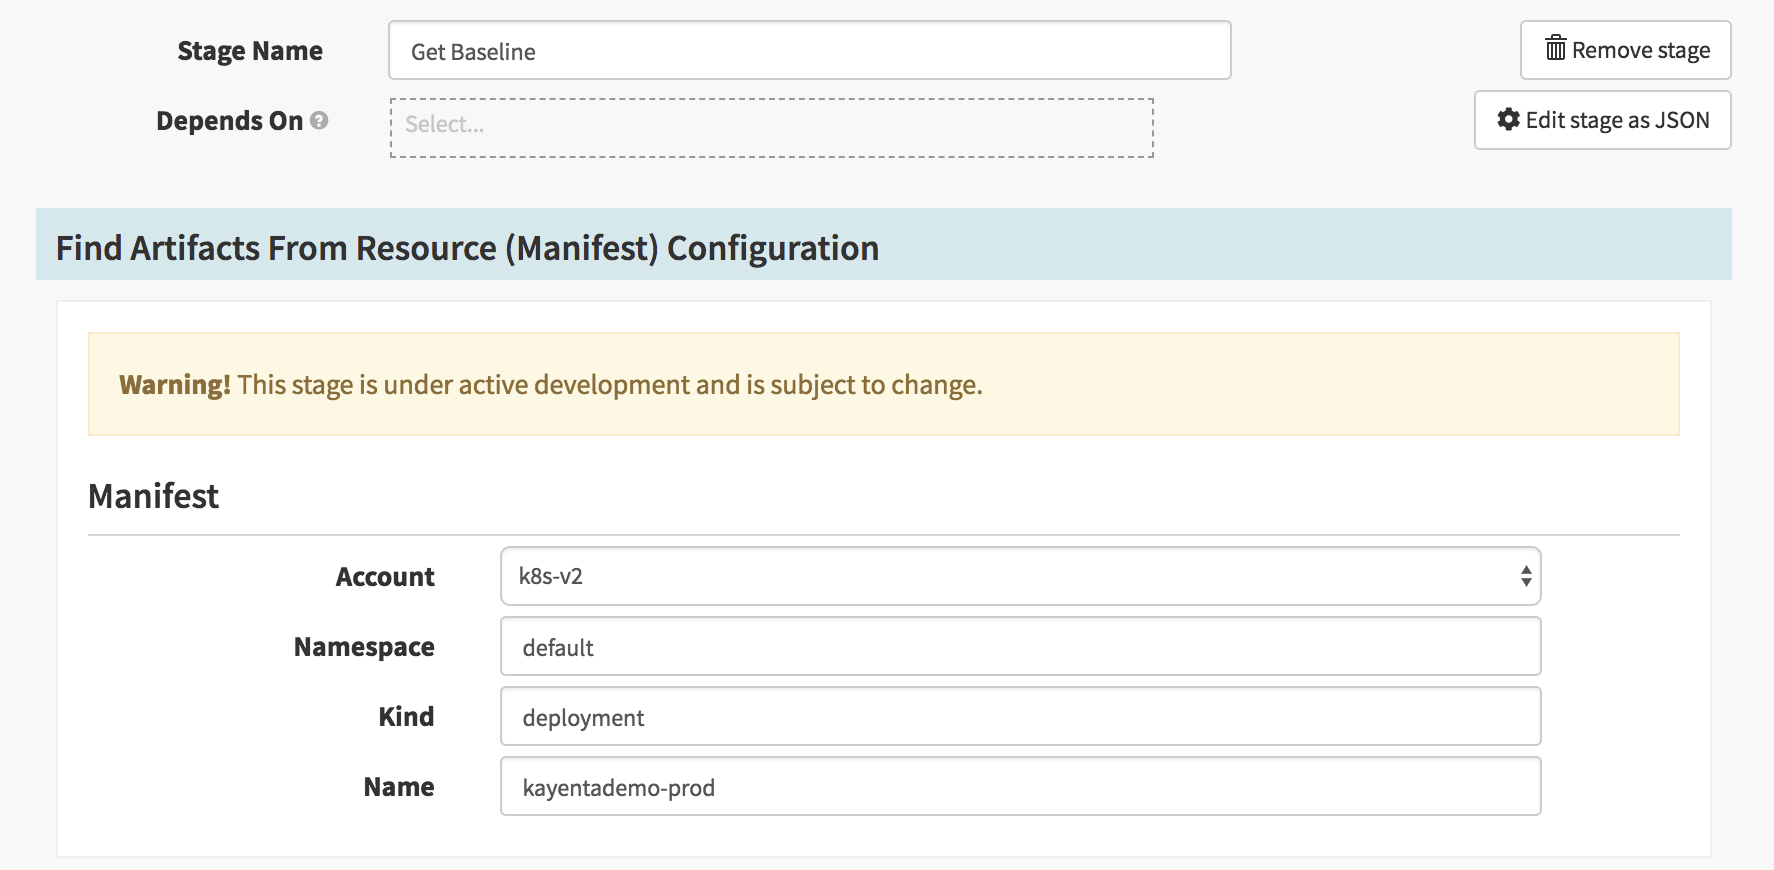
Find the Baseline Version
In this example, we are triggering off a Jenkins job that produces a Docker
image and provides the image hash in a properties file that Spinnaker can
pick up. Our first real stage is to figure out what’s currently running
in our production Deployment (Get Baseline). For this, we use a
Find Artifacts From Resource (Manifest) stage:
Deploy Baseline Manifest
The next two stages (Deploy Baseline and Deploy Canary) are both Deploy
(Manifest) stages; in this example we’re using text manifests for clarity.
Our baseline manifest is named with a -baseline suffix to help identify its
metrics from regular production metrics. We use a Spinnaker expression to
substitute in the current production image hash we found in the previous
stage, and set an environment variable on these pods to help them differentiate
their data from other production pods:
- apiVersion: apps/v1
  kind: Deployment
  metadata:
    name: kayentademo-baseline
  spec:
    replicas: 1
    selector:
      matchLabels:
        app: kayentademo
    template:
      metadata:
        labels:
          app: kayentademo
      spec:
        containers:
          - image: '${#stage(''Get Baseline'').context["artifacts"][0]["reference"]}'
            name: kayentademo
            env:
            - name: version
              value: baseline
Deploy Canary Manifest
Our canary manifest is very much the same, except we’ve swapped out the
references to baseline (in the deployment name and environment variable)
and we’re using the trigger’s build properties to identify the Docker image
hash:
- apiVersion: apps/v1
  kind: Deployment
  metadata:
    name: kayentademo-canary
  spec:
    replicas: 1
    selector:
      matchLabels:
        app: kayentademo
    template:
      metadata:
        labels:
          app: kayentademo
      spec:
        containers:
          - image: 'docker.io/armory/kayentademo-testapp:${trigger.properties["TESTAPP_VERSION"]}'
            name: kayentademo
            env:
            - name: version
              value: canary
Run Canary Analysis
The Canary Analysis stage is dependent on both of those stages being complete; we don’t want to begin our analysis until we’re sure both the baseline and canary deployments are up and running.
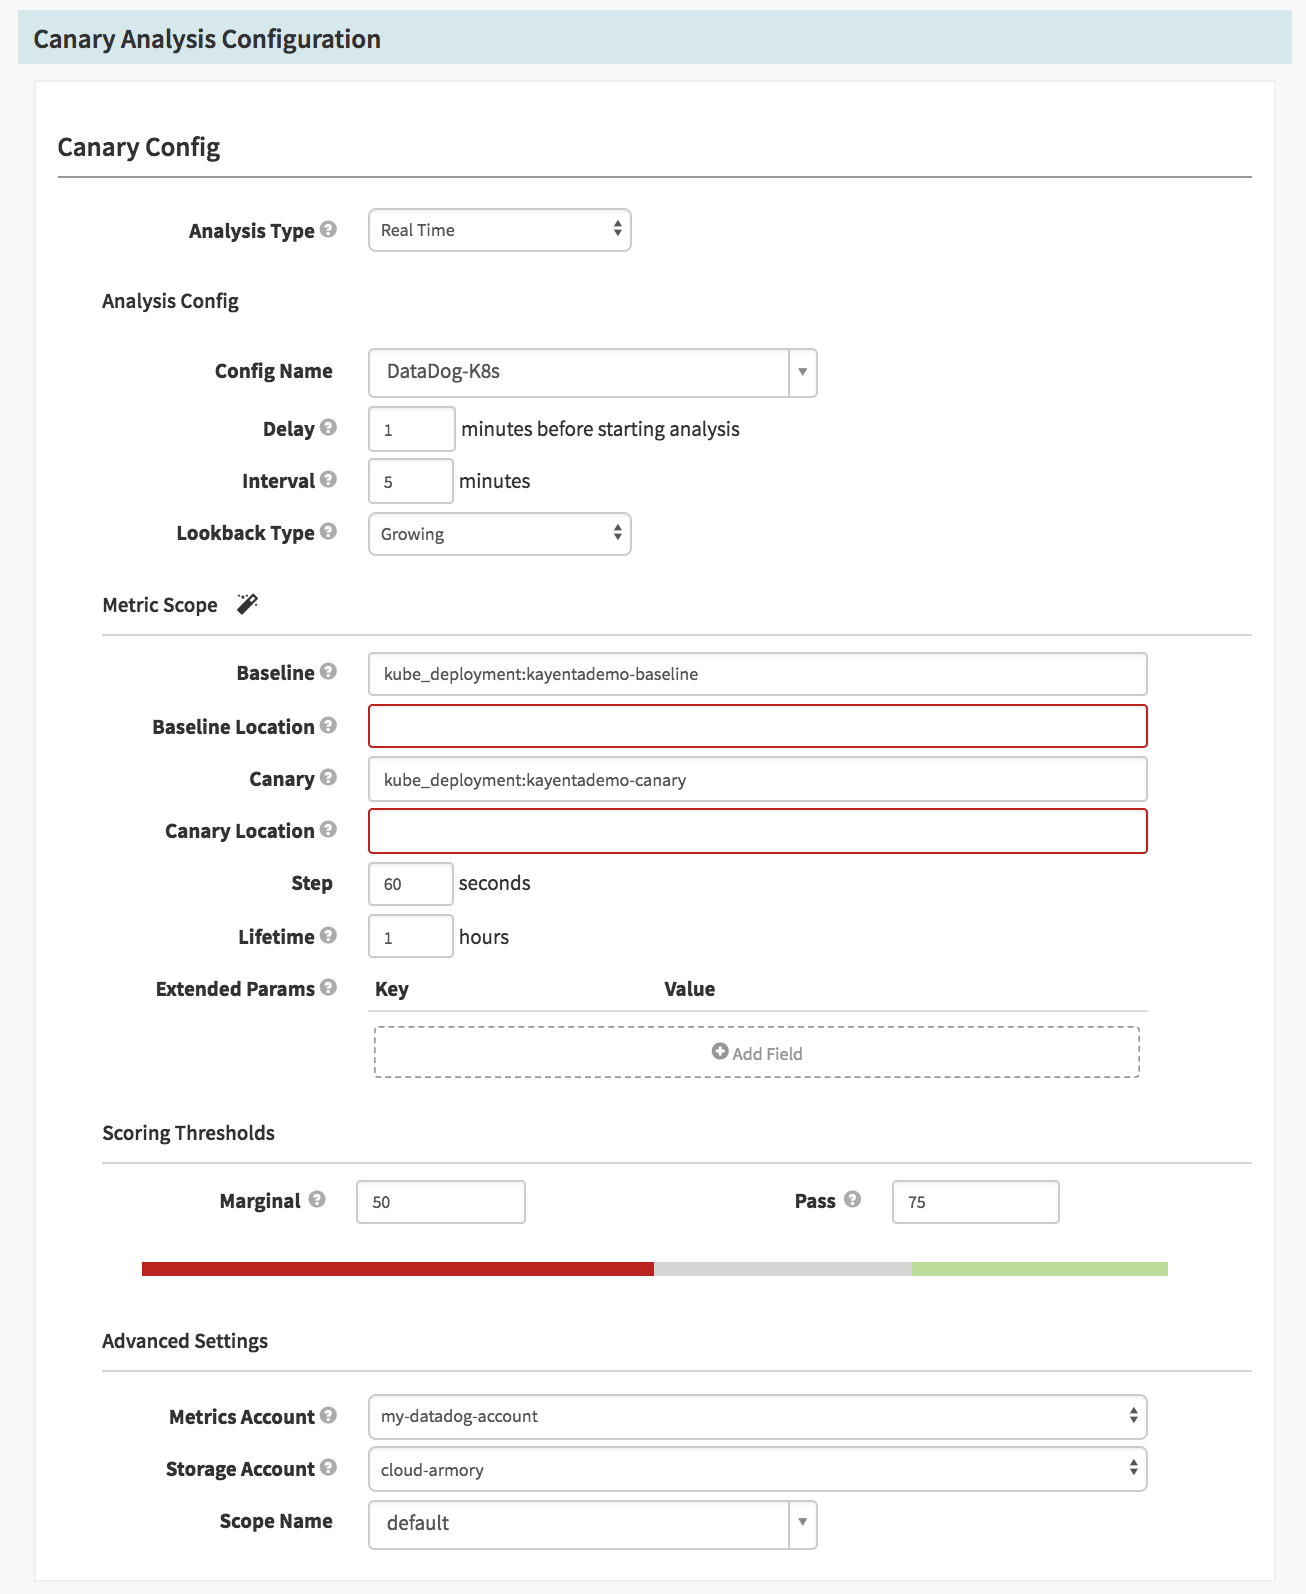
We’ve selected the DataDog-K8s Canary Config, a 1-minute delay before
starting analysis (to give the pods a little more time to settle), and we’re
looking for 5-minute intervals, growing (so the reports look back from the
start of the run, growing in length over time), and running for a Lifetime
of 1 hour.
For the Metric Scope, we can simply hardcode the deployment names –
kube_deployment:kayentademo-baseline and kube_deployment:kayentademo-canary
– since we set them specifically in the previous manifests. For DataDog,
the Location fields aren’t used, so we’ve left them blank.
We select our metrics account (Datadog) and our Storage account, and set the
Scope Name to default.
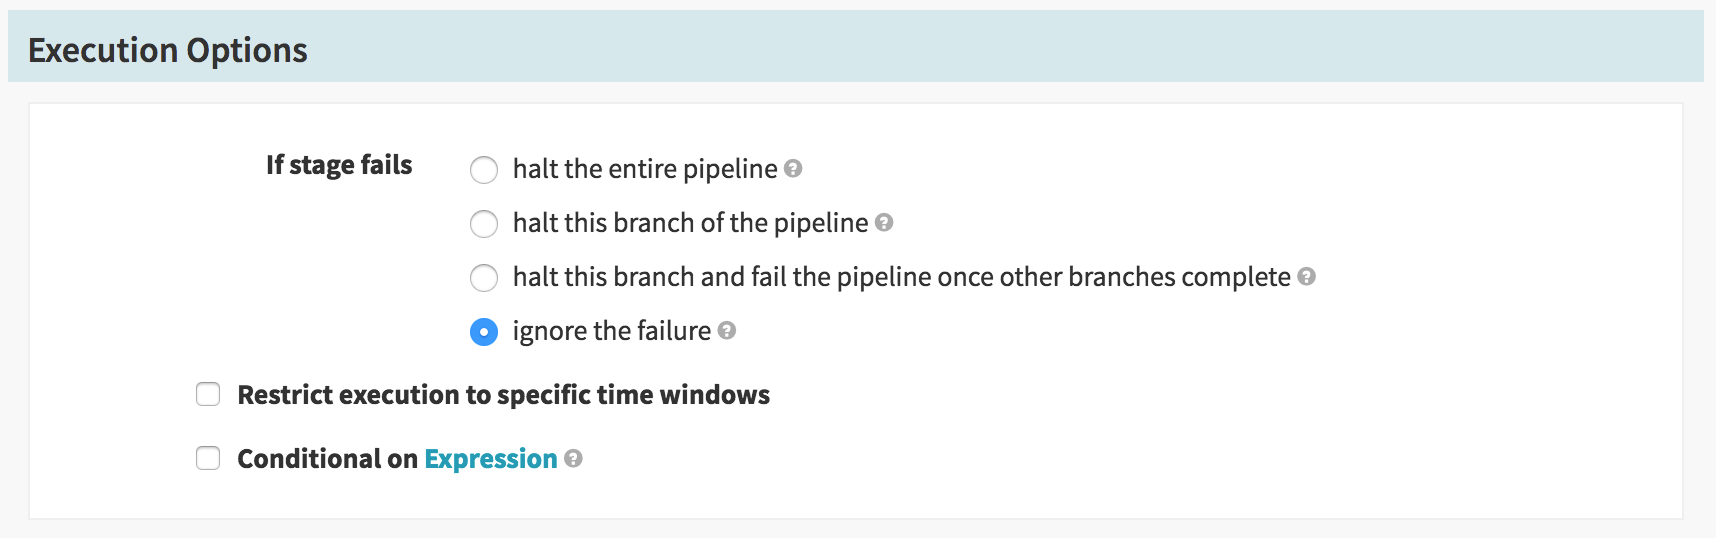
One more important thing to set on this stage is the Execution Option;
we don’t want to stop the pipeline if the canary fails, or we won’t have a
chance to clean up the baseline and canary deployments. So we choose to
ignore the failure:
When the analysis stage ends, we want to do few things, all at the same time. We want to clean up the baseline and canary stages, regardless of the outcome, so we don’t have a bad canary or and old baseline serving requests. We also want to deploy the new code (if it passed the canary analysis) to our production deployment.
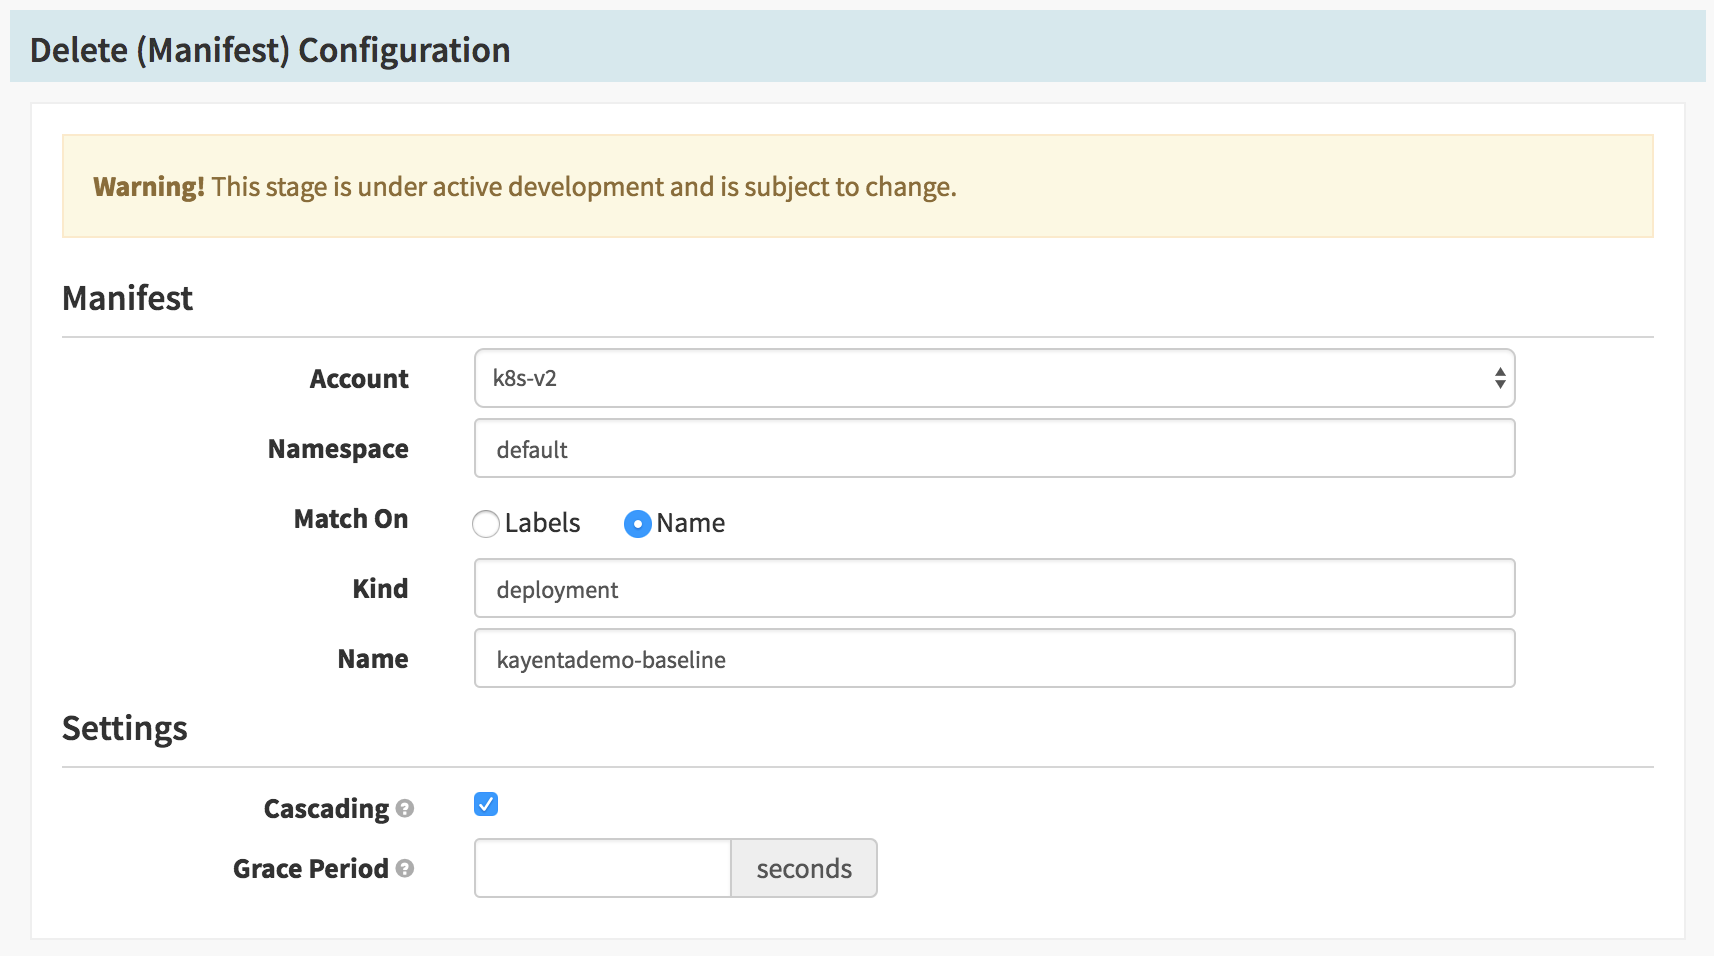
Clean Up
Destroying our deployments is easy with the Delete (Manifest) stage, we
just identify the deployment name we used earlier. We run one stage for
Baseline and one for Canary, in parallel (just showing the stage for the
baseline – for the canary, we just change the name):
Deploy to Production
Confident our new code performs at least as well under load as our old code,
we can now deploy the new Docker image to our production deployment name,
kayentademo-prod:
- apiVersion: apps/v1
  kind: Deployment
  metadata:
    name: kayentademo-prod
  spec:
    replicas: 1
    selector:
      matchLabels:
        app: kayentademo
    template:
      metadata:
        labels:
          app: kayentademo
      spec:
        containers:
          - image: 'docker.io/armory/kayentademo-testapp:${trigger.properties["TESTAPP_VERSION"]}'
            name: kayentademo
            env:
            - name: version
              value: canary
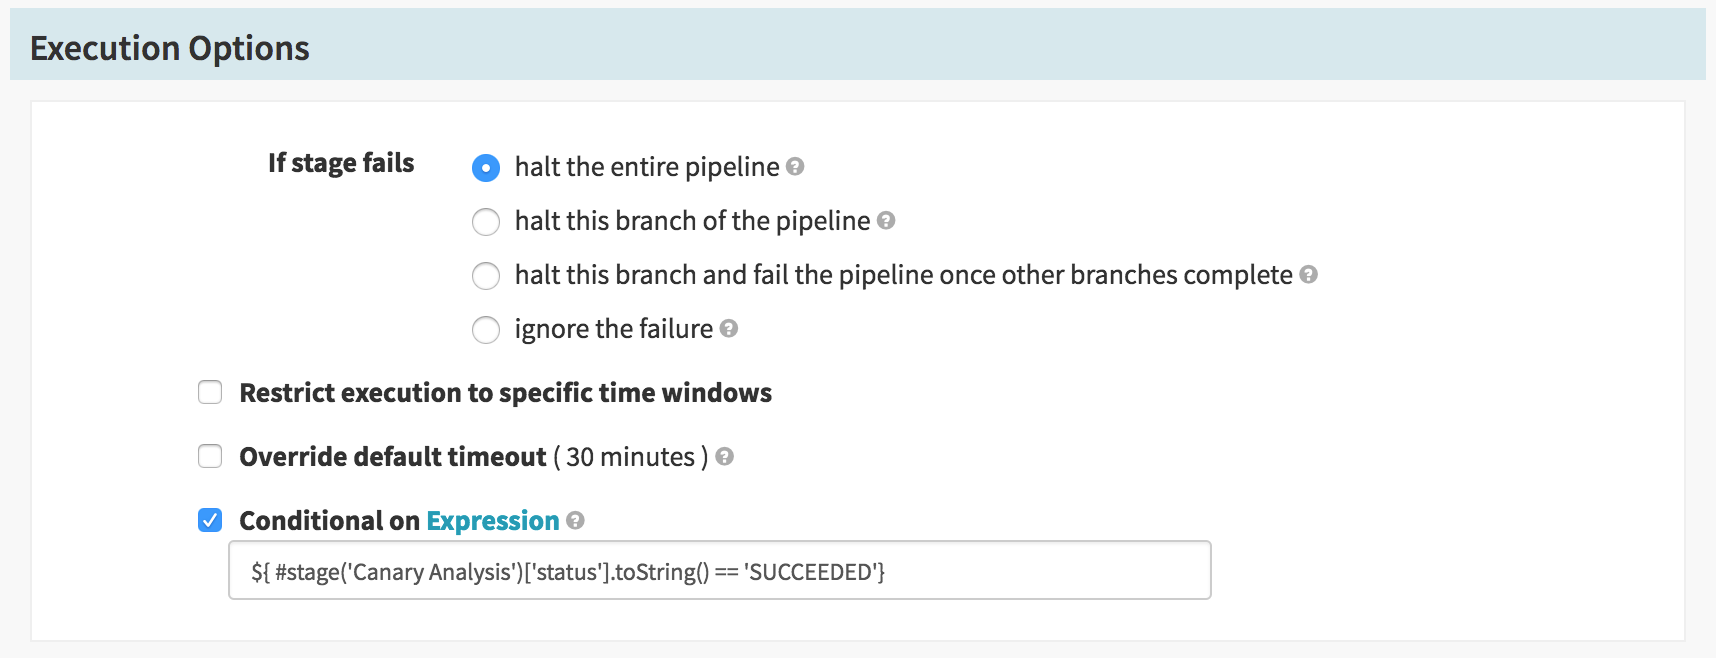
Of course, we don’t want to do this at all if the canary failed to live up
to expectations, so we only do this stage conditionally. Under Execution
Options we want to make this Conditional on Expression and then we check
the status of our Canary Analysis stage:
Final Grade
Finally, when all of that cleanup and promotion is done, we want to end on
either a total success or a failure. For this, we’ll use a Check
Preconditions to also look back and check to see if the canary was successful
or not. We add a precondition and select Expression and enter in the same
condition as for our production deploy stage:
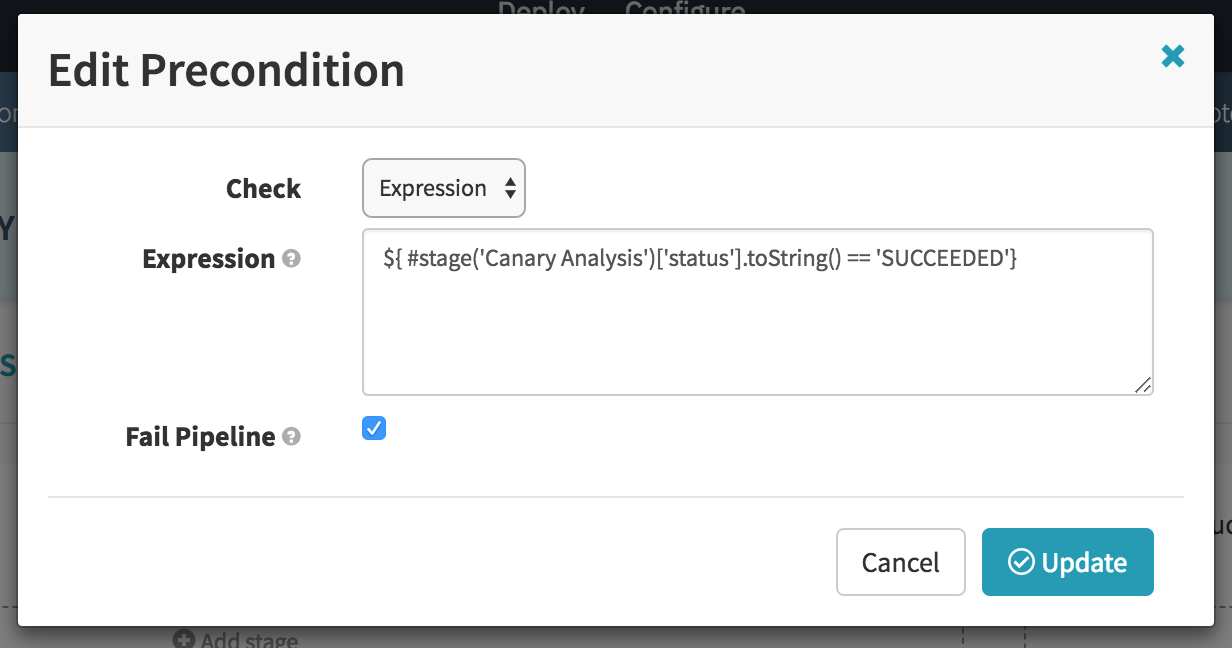
This stage will fail if the condition isn’t satisfied, and pass if it has.
Now our pipeline has completed. If the canary succeeded, our new code has been promoted to production and the next change can be picked up. If the canary failed, the pipeline will have cleaned up its canary, production will have remained untouched, and the pipeline can be set up to alert someone to the failure. Maybe the next Jenkins job will have the fix…
See Also
This is just a very lightweight example of how you can use Kayenta to automate canary analysis before rolling code out to production. For different takes on the subject, the following resources might be helpful: